


BibTeX | RIS | EndNote | Medlars | ProCite | Reference Manager | RefWorks
Send citation to:
URL: http://jnfs.ssu.ac.ir/article-1-280-en.html


 , Reza Bidaki , Mahdieh Hosseinzadeh , Farhang Mirzavandi , Amin Salehi-Abargouei *
Yadollah Khoshbakht; MSc1,2, Reza Bidaki; MD3, Mahdieh Hosseinzadeh; PhD1,2, Farhang Mirzavandi; MSc1,2 & Amin Salehi-Abargouei; PhD1,2*
1 Nutrition and Food Security Research Center, Shahid Sadoughi University of Medical Sciences, Yazd, Iran.
2 Department of Nutrition, School of Public Health, Shahid Sadoughi University of Medical Sciences, Yazd, Iran.
3 Department of Psychiatry, Research Center of Addiction and Behavioral Sciences, Shahid Sadoughi University of Medical Sciences, Yazd, Iran.
|
ARTICLE INFO |
|
ABSTRACT |
|
ORIGINAL ARTICLE |
Background: Attention deficit hyperactivity disorder (ADHD) is one of the most common psychiatric disorders in children. Children with ADHD usually have low blood pressure and weight disorders. Therefore, the present randomized clinical trial was conducted to evaluate the effect of Dietary Approaches to Stop Hypertension (DASH) on weight and blood pressure of children with ADHD. Methods: In this research, 86 children aged 6 to 12 years with diagnosed ADHD according to Conner’s Teacher's Questionnaire and DSM-4 criteria were investigated. Participants were randomly assigned into two groups to receive a DASH diet and a control diet for 12 weeks. Participants' anthropometric indices, blood pressure, physical activity, and dietary compliance were evaluated each month. Adherence to the diet was studied using a three-day food report completed by the participants' parents. Results: A total of 80 children completed the study (40 in each group). No significant difference was observed in any of the weight composition indices measured before and after the intervention between the study groups (P > 0.05). No significant difference was reported in the systolic and diastolic blood pressure between the study groups at the baseline. However, diastolic blood pressure increased in the DASH group significantly compared to the control group (P = 0.02). Conclusion: The DASH diet might increase the diastolic blood pressure in children with ADHD. Further studies with a longer follow-up period are necessary to confirm these results. |
|
|
Article history: |
||
|
IRCT ID: |
||
|
*Corresponding author |
Introduction
Weight and blood pressure (BP) are factors associated with ADHD (Byrd et al., 2013, Wilens et al., 2005). In a study on a large number of German teenagers, Meyer et al. found a significant relationship between low BP and ADHD symptoms (Meyer et al., 2017). Several studies examined the relationship between ADHD and obesity (Azadbakht and Esmaillzadeh, 2012, Fliers et al., 2013). A systematic review and meta-analysis also showed that ADHD had a significant relationship with overweight and obesity. The study also found that prevalence of obesity in children with ADHD was about 40% higher than the healthy children. Moreover, the prevalence of obesity in adults with ADHD was 70% higher than the normal population (Cortese et al., 2015).
Different nutritional factors are effective on ADHD including food and artificial colors, artificial sweeteners and sugars, amino acids (tryptophan, phenylalanine and tyrosine), vitamins and minerals, essential fatty acids, and restrictive diets (Heilskov Rytter et al., 2015). Dietary Approaches to Stop Hypertension (DASH) is a diet rich in fruits, vegetables, whole grains, low-fat dairy products, cereals, and low-fat meals. It also contains low levels of sodium, saturated and total fat, as well as high levels of calcium, magnesium, potassium, and vitamin C (Sacks et al., 2001). This is a low-glycemic and low-energy diet effective in managing the BP (Sacks et al., 2001). Recent studies showed that this diet, affects not only BP (Saneei et al., 2014), but also other diseases such as type 2 diabetes (Shirani et al., 2013), cardiovascular disease (Shirani et al., 2013), lipid profile, and glucose tolerance in pregnancy diabetes (Asemi et al., 2013).
The DASH diet lowers BP in people with hypertension, but it does not affect normal BP (Saneei et al., 2014). This diet also controls weight and causes weight loss in adults with overweight and obesity (Soltani et al., 2016).
The prevalence of ADHD is high in the world and in Iran, especially Yazd. Furthermore, no study has ever investigated the effect of a healthy diet on weight and BP in children with ADHD. So, the present controlled clinical trial evaluated the effect of DASH diet on weight and BP in children with ADHD.
Materials and Methods
Study design and participants: A total of 253 children within the age range of 6 to 12 years were diagnosed with ADHD according to the Conner’s Teacher's Questionnaire and DSM-4 criteria by a specialist. Of these, 27 did not meet the inclusion criteria and 140 were not willing to participate in the study. Finally, 86 children entered the study (Figure 1). The exclusion criteria were having other neurological diseases associated with ADHD, low IQ (less than 70), prematurity at birth, sudden dietary changes or non-compliance with the prescriptive diet, and reluctance to continue to participate in the study with any reason, being an adopted child, and using drugs.
This randomized clinical trial was conducted in Yazd, Iran. A total of 86 children were randomly divided into two groups of DASH diet and control diet by simple random sampling using SPSS software. The intervention lasted 12 weeks. The participants' anthropometric indices, BP measurements, physical activity, and dietary compliance were evaluated each month. This process was conducted every month until the end of the third month of follow-up.
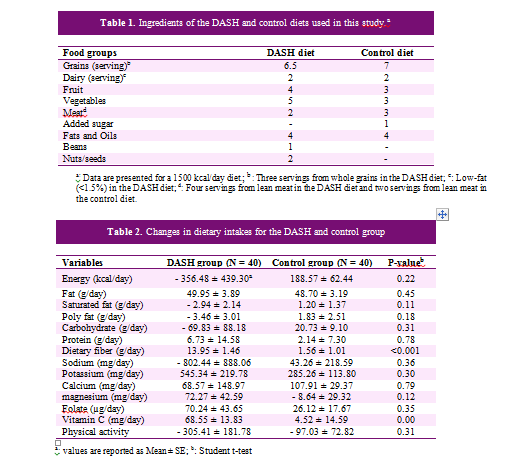
Diets: The required energy intake was calculated for each child by the researcher using the American Institute of Food and Drug Administration's Medical Institute formula based on their weight, height, age, and physical activity level determined by a questionnaire at the beginning of the study (Gidding et al., 2006). The children were randomly assigned into two diet groups: DASH diet and control diet. DASH diet was given to participants according to macronutrient ratio of 50-60% carbohydrate, 25-30% fat, and 15-20% protein for the intervention group along with a succession of food groups. The DASH diet contains high amounts of whole grains, fruits, vegetables and low-fat dairy products, cereals, as well as low amounts of saturated fats, cholesterol, refined grains, sweets, and red meat (Sacks et al., 2001). In this diet, calcium, potassium, and magnesium contents of DASH diet are higher than the recommendations provided by the US Department of Agriculture. Control group diet was similar to the DASH diet with regard to the macronutrient contents: 60-50% carbohydrates, 25-30% fat, and 15-20% protein, which was similar to the usual Iranian diet (Azadbakht et al., 2005). Table 1 shows the food groups of the DASH diet compared to the control diet for a 1500 kcal diet.
Measurements: The participants' weight was measured using the Omron BF511 (Omron Inc. Osaka, Japan) body analyzer with a precision of 0.1 kg, while people stand in the middle of the balance in light clothing. Height was also measured in cm in standing position by a fixed height gauge. Body mass index (BMI) was measured by dividing the weight (in kilograms) by height (in squared m). To determine the waist circumference (WC), an elastic plastic meter was applied with a precision of 0.5 cm. The WC was measured at the distance between the three iliac crests and the lowest rib in standing position. To measure the hip circumference, the largest hip circumference was measured with a precision of 0.5 cm. The percentage of body fat and body muscle percentage were also measured using Omron BF511 (Omron Inc. Osaka, Japan) body analyzer. All anthropometric measurements were performed by a trained nutritionist. Anthropometric measurements were performed for each person three times and the values were recorded at least twice for each person.
BP was also measured three times using a standard mercury pressure gauge with a 5-minute interval.
For evaluation of the dietary intakes, the 24-hour recall was initially administered and the three-day dietary records including two workdays and a weekend day were used before each visit, which were completed by parents. Dietary records were analyzed for their energy and nutrient content using Nutritionist-IV software (version 3.5.2, Axxya Systems, Redmond, Washington, USA) modified for Iranian food items. Parents were also asked to record their children’s physical activity before each visit. Physical activity information was converted to metabolic equivalent-hour/day (Met-h/day) using the MET intensity, type, and duration of each activity.
Data analysis: The normal distribution of quantitative data was investigated using Kolmogrov-Smirnov statistical test. All data had normal distribution. Independent samples t-test was used to compare the quantitative variables between the intervention and the control groups. Paired samples t-test was used to evaluate the within group changes in the two groups. The age and gender comparisons for the quantitative variables were done using analysis of covariance (ANCOVA) by bonferroni correction. Data were reported in mean ± standard error (SE). P-values of less than 0.05 (2-tailed) were considered as statistically significant. Statistical analyses were performed using statistical package for social sciences software version 25 (IBM SPSS, Tokyo, Japan).
Ethical considerations: The study protocol was approved by Ethics Committee of Faculty of Health, Shahid Sadoughi University of Medical Sciences, Yazd, Iran (Ethics code: IR.SSU.SPH.REC.1395.106). The study was also registered in the Iranian Registry of Clinical Trials on January 8, 2018 (IRCT, www.irct.ir, registration ID: IRCT20130223012571N6). The children's parents were provided with verbal and written information about the study goals. They were also asked to sign informed consent forms before participating in the study.
Results
After 12 weeks, three children were removed from DASH group (2 children due to lack of motivation to continue the study and one due to starting the medication use). In the control group, three children were excluded (2 children due to lack of motivation and one child due to immigration from Yazd city). A total of 80 participants (40 in each group) completed the study (Figure 1).
The means (± SE) for age, weight, and height at the beginning of the study were 8.67 ± 0.25, 28.90 ± 1.38 kg, and 129.55 ± 1.44 cm in DASH group and 8.41 ± 0.24, 27.39 ± 1.17 kg, and 128.44 ± 1.72 cm in the control group, respectively. No difference was observed between the study groups based on the baseline data (P > 0.05).
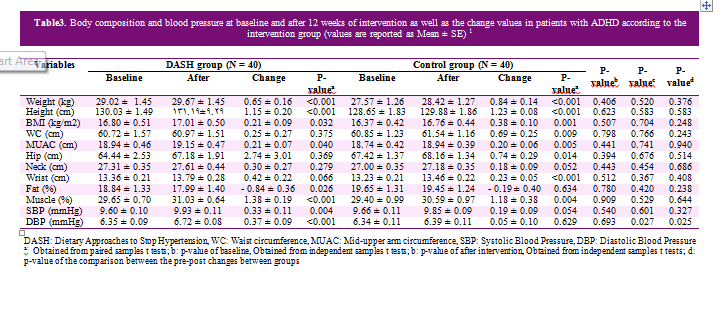
The average consumption of nutrient intake based on a 3-day diet and physical activity during the intervention period are presented in Table 2. Based on the 24-hour food intake, the fat, dietary fiber, vitamin C, and potassium groups increased significantly in DASH group. Moreover, a significant increase was observed in energy, fat, carbohydrate, and calcium intakes in control group. No significant difference was seen in dietary intake between DASH group and control at the beginning of the study. However, a significant difference was found in the mean change between the beginning and end of the study regarding the vitamin C intake (P = 0.002) and dietary fiber (P < 0.001) between DASH and control groups.
At the beginning and end of the study, no significant difference was reported in physical activity between DASH group and control group. Furthermore, no significant difference was found between the mean changes in physical activity between the two groups (P = 0.35).
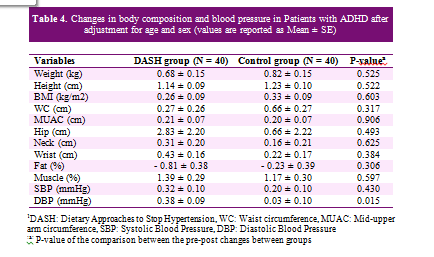
Table 3 shows the body composition indices before and after the intervention period in the intervention group. The results revealed that weight, BMI, middle arm muscle circumference (MUAC), and muscle mass significantly increased, while the body fat percent decreased significantly (P = 0.02). The wrists' diameter also marginally increased (P = 0.06), but the waist, hip, and neck circumferences did not increase significantly (P = 0.37, P = 0.36, and P = 0.27, respectively). In the control group, weight, height, body mass index, waist circumference, hip circumference, wrist circumference, MUAC, and body muscle percent increased significantly. The neck circumference marginally increased (P = 0.05), but body fat percentage did not decrease significantly (P = 0.63). No significant difference was observed in body composition before and after the intervention period. The mean difference was not significant before and after the intervention between the DASH and control groups.
Table 3 represents the systolic BP (SBP) and diastolic BP (DBP) before and after the intervention period in DASH and control groups. No significant difference was observed in the SBP and DBP at baseline between the two groups. According to these data, systolic and diastolic BP increased significantly in the DASH group (P < 0.05). In the control group, the SBP marginally increased (P < 0.05) and the DBP did not increase significantly (P > 0.05). No significant difference was observed at the end of the study in SBP (P > 0.05), but a significant difference was found at the end of study in DBP between study groups (P = 0.02). The mean change before and after the study between the two groups of DASH and control was not different in SBP (P = 0.32); whereas, the change in the DBP was significantly different (P = 0.02).
Table 4 shows the mean changes in body composition and BP indices of the DASH and the control groups after adjusting for age and gender. The mean changes in body composition and BP were not significant between the intervention and control groups. The results revealed that the mean changes in SBP were not different between the two groups after adjusting for age and gender. However, the DBP increased significantly in the DASH group compared to the control group (P < 0.05).
Figure 2 represents the effect of DASH diet compared to the control diet on SBP (A), DBP (B), body fat percent (C), and BMI (D) according to the study visits after adjusting for age and gender. A significant difference was found in mean difference of DBP only in the last month of the study. However, no significant difference was seen in other visits. Increased trend of SBP and BMI as well as reduction of body fat percentage were not significant.
.PNG)
.PNG)
.PNG)
.PNG)
Some studies investigated the effect of foods on weight and body composition in children. Some of these studies confirmed our findings. Berz et al. conducted a study in the United States and showed that adolescent girls with DASH diet gained less weight after 10 years. The results also indicated that such a pattern might help prevent overweight during adolescence (Berz et al., 2011). Similarly, our study also showed that DASH diet could prevent weight gain significantly. Another study showed that a diet containing many components abundant in the DASH dietary pattern led to a lower BMI increase in long term (Newby et al., 2003). Another study reported that the DASH diet might reduce the body composition indices in obese participants (Hajna et al., 2012).
As mentioned above, our results did not show any significant difference in the means of body composition between the two groups, but the results were significant in the control group. this results can be justified by mentioning that the control group diet was also a healthy diet designed based on the amount of energy needed by the participants and the macronutrient percentage, which was similar to the DASH diet.
Our results regarding the effect of DASH diet on BP was different from previous studies. Studies that examined the effect of DASH diet on BP in children and adolescents showed that the DASH diet reduced SBP and DBP (Conlin et al., 2000, Couch et al., 2008). However, our findings showed that the DASH diet increased SBP and DBP in children with ADHD. According to the previous studies, children with ADHD had a low BP (Meyer et al., 2017). Our results showed that the means (± SD) of the SBP and DBP in the baseline were 9.67 ± 0.07 and 6.35 ± 0.07, respectively, which confirmed the results of previous studies. According to the criteria set by the Fourth Report on the Diagnosis, Evaluation, and Treatment of High BP in Children and Adolescents (Pediatrics, 2004) , normal BP in children is defined as SBP and DBP less than 90th percentile for age, gender, and height, while hypertension is defined as SBP and/or DBP of persistent 95th percentile or more. The 90th percentile of SBP in boys and girls with 6-12 years of age was within 113 to 123 and 110 to 121, respectively. The boys’ and girls' 90th percentile of DBP was within 72 to 78 and 71 to 78, respectively. In fact, our results increased to a normal blood pressure.
A DASH diet can reduce weight and body fat percentages and increases muscle mass by several mechanisms. This diet is rich in fruits and vegetables and fruits and vegetables reduce weight (Buijsse et al., 2009). The DASH diet has low dietary fat and high protein intake and evidences indicate that high protein diet changes body composition and weight loss (Clifton et al., 2014). Previous reviews showed that other DASH components such as dairy products (Abargouei et al., 2012), dietary fiber (Chew and Brownlee, 2018), and omega-3 fatty acids (Keshavarz et al., 2018) also caused weight loss. The DASH diet, for various reasons, affects blood pressure; for example, since this diet is rich in calcium, potassium, and magnesium, it can contribute to regulation of the blood pressure by regulating vascular resistance and promoting vasodilators (Houston and Harper, 2008).
One of the strengths of this study was including a large number of children in the intervention and the control groups. Furthermore 93% of the participants managed to complete the study. One of the weaknesses of this study can be the evaluation method for assessing the dietary compliance. We could not get a blood sample or 24-hour urine specimen to assess the participants' compliance with DASH diet; so, we only used the 3-day dietary records to examine their compliance. Another weakness of this research was the short duration of the study.
In conclusion, the present clinical trial showed that compliance with DASH diet for 12 weeks could significantly increase the DBP of children with ADHD. The diet did not significantly affect body weight and composition compared to the control diet. Further clinical trials with more follow-up period are needed to confirm these results.
References
Abargouei AS, Janghorbani M, Salehi-Marzijarani M & Esmaillzadeh A 2012. Effect of dairy consumption on weight and body composition in adults: a systematic review and meta-analysis of randomized controlled clinical trials. International journal of obesity. 36 (12): 1485.
Akhavan Karbasi S, Golestan M, Fallah R & Sadr Bafghi M 2008. Prevalence of attention deficit hyperactivity disorder in 6 year olds of Yazd city. Journal of Shahid Sadoughi University of meical sciences. 15 (4): 29-34 (Persian).
Asemi Z, Tabassi Z, Samimi M, Fahiminejad T & Esmaillzadeh A 2013. Favourable effects of the Dietary Approaches to Stop Hypertension diet on glucose tolerance and lipid profiles in gestational diabetes: a randomised clinical trial. British journal of ntrition. 109 (11): 2024-2030.
Attention-deficit So 2011. ADHD: clinical practice guideline for the diagnosis, evaluation, and treatment of attention-deficit/hyperactivity disorder in children and adolescents. Pediatrics. 128 (5): 1007-1022.
Azadbakht L & Esmaillzadeh A 2012. Dietary patterns and attention deficit hyperactivity disorder among Iranian children. Nutrition. 28 (3): 242-249.
Azadbakht L, Mirmiran P, Hosseini F & Azizi F 2005. Diet quality status of most Tehranian adults needs improvement. Asia Pacific journal of clinical nutrition. 14 (2): 163-168.
Berz JP, Singer MR, Guo X, Daniels SR & Moore LL 2011. Use of a DASH food group score to predict excess weight gain in adolescent girls in the National Growth and Health Study. Archives of pediatrics & adolescent medicine. 165 (6): 540-546.
Biederman J 2005. Attention-deficit/hyperactivity disorder: a selective overview. Biological psychiatry. 57 (11): 1215-1220.
Buijsse B, et al. 2009. Fruit and vegetable intakes and subsequent changes in body weight in European populations: results from the project on Diet, Obesity, and Genes (DiOGenes)–. American journal of clinical nutrition. 90 (1): 202-209.
Byrd HM, Curtin C & Anderson SE 2013. Attention‐deficit/hyperactivity disorder and obesity in US males and females, age 8–15 years: N ational H ealth and N utrition E xamination S urvey 2001–2004. Pediatric obesity. 8 (6): 445-453.
Chew KY & Brownlee IA 2018. The impact of supplementation with dietary fibers on weight loss: A systematic review of randomised controlled trials. Bioactive carbohydrates and dietary fibre. 14: 9-19.
Clifton PM, Condo D & Keogh JB 2014. Long term weight maintenance after advice to consume low carbohydrate, higher protein diets–a systematic review and meta analysis. Nutrition, metabolism and cardiovascular diseases. 24 (3): 224-235.
Conlin PR, et al. 2000. The effect of dietary patterns on blood pressure control in hypertensive patients: results from the Dietary Approaches to Stop Hypertension (DASH) trial. American journal of hypertension. 13 (9): 949-955.
Cortese S, et al. 2015. Association between ADHD and obesity: a systematic review and meta-analysis. American journal of psychiatry. 173 (1): 34-43.
Couch SC, et al. 2008. The efficacy of a clinic-based behavioral nutrition intervention emphasizing a DASH-type diet for adolescents with elevated blood pressure. Journal of pediatrics. 152 (4): 494-501.
Elia J, Ambrosini P & Berrettini W 2008. ADHD characteristics: I. Concurrent co-morbidity patterns in children & adolescents. Child and adolescent psychiatry and mental health. 2 (1): 15.
Fliers EA, et al. 2013. ADHD is a risk factor for overweight and obesity in children. Journal of developmental and behavioral pediatrics: JDBP. 34 (8): 566-574.
Gidding SS, et al. 2006. Dietary recommendations for children and adolescents: a guide for practitioners. Pediatrics. 117 (2): 544-559.
Hajna S, et al. 2012. Association between body composition and conformity to the recommendations of Canada's Food Guide and the Dietary Approaches to Stop Hypertension (DASH) diet in peri-adolescence. Public health nutrition. 15 (10): 1890-1896.
Heilskov Rytter MJ, et al. 2015. Diet in the treatment of ADHD in children—A systematic review of the literature. Nordic journal of psychiatry. 69 (1): 1-18.
Houston MC & Harper KJ 2008. Potassium, magnesium, and calcium: their role in both the cause and treatment of hypertension. Journal of clinical hypertension. 10 (7): 3-11.
Keshavarz SA, et al. 2018. Omega-3 supplementation effects on body weight and depression among dieter women with co-morbidity of depression and obesity compared with the placebo: A randomized clinical trial. Clinical nutrition ESPEN. 25: 37-43.
Klein RG, et al. 2012. Clinical and functional outcome of childhood attention-deficit/hyperactivity disorder 33 years later. Archives of general psychiatry. 69 (12): 1295-1303.
Mannuzza S, Klein RG, Bessler A, Malloy P & LaPadula M 1993. Adult outcome of hyperactive boys: Educational achievement, occupational rank, and psychiatric status. Archives of general psychiatry. 50 (7): 565-576.
Meyer T, Becker A, Sundermann J, Rothenberger A & Herrmann-Lingen C 2017. Attention deficit-hyperactivity disorder is associated with reduced blood pressure and serum vitamin D levels: results from the nationwide German Health Interview and Examination Survey for Children and Adolescents (KiGGS). European child & adolescent psychiatry. 26 (2): 165-175.
Newby PK, et al. 2003. Dietary patterns and changes in body mass index and waist circumference in adults. American journal of clinical nutrition. 77 (6): 1417-1425.
Pediatrics AAo 2004. National high blood pressure education program working group on high blood pressure in children and adolescents. Pediatrics. 114 (Supplement 2): iv-iv.
Polanczyk G, De Lima MS, Horta BL, Biederman J & Rohde LA 2007. The worldwide prevalence of ADHD: a systematic review and metaregression analysis. American journal of psychiatry. 164 (6): 942-948.
Sacks FM, et al. 2001. Effects on blood pressure of reduced dietary sodium and the Dietary Approaches to Stop Hypertension (DASH) diet. New England journal of medicine. 344 (1): 3-10.
Saneei P, Salehi-Abargouei A, Esmaillzadeh A & Azadbakht L 2014. Influence of Dietary Approaches to Stop Hypertension (DASH) diet on blood pressure: a systematic review and meta-analysis on randomized controlled trials. Nutrition, metabolism and cardiovascular diseases. 24 (12): 1253-1261.
Shirani F, Salehi-Abargouei A & Azadbakht L 2013. Effects of Dietary Approaches to Stop Hypertension (DASH) diet on some risk for developing type 2 diabetes: a systematic review and meta-analysis on controlled clinical trials. Nutrition. 29 (7-8): 939-947.
Soltani S, Shirani F, Chitsazi MJ & Salehi‐Abargouei A 2016. The effect of dietary approaches to stop hypertension (DASH) diet on weight and body composition in adults: a systematic review and meta‐analysis of randomized controlled clinical trials. Obesity reviews. 17 (5): 442-454.
Wilens TE, et al. 2005. Blood pressure changes associated with medication treatment of adults with attention-deficit/hyperactivity disorder. Journal of clinical psychiatry. 66 (2): 253-259.
Received: 2019/08/21 | Published: 2020/05/1 | ePublished: 2020/05/1
| Rights and permissions | |
 |
This work is licensed under a Creative Commons Attribution-NonCommercial 4.0 International License. |
