
Fri, Nov 20, 2026
[Archive]
Volume 11, Issue 4 (11-2026)
J Nutr Food Secur. 2026, 11(4): 529-539 |
Back to browse issues page


Download citation:
BibTeX | RIS | EndNote | Medlars | ProCite | Reference Manager | RefWorks
Send citation to:


BibTeX | RIS | EndNote | Medlars | ProCite | Reference Manager | RefWorks
Send citation to:
Shareghfarid E, Dorosty Motlagh A, Takian A, Esmaeilzadeh A. Food-based Dietary Inflammatory Index Trend and Dietary Inflammatory Index Determinants for the Period (1991–2021) in Iran. , J Nutr Food Secur.. 2026; 11 (4) :529-539
URL: http://jnfs.ssu.ac.ir/article-1-1585-en.html
URL: http://jnfs.ssu.ac.ir/article-1-1585-en.html

Department of Community Nutrition, School of Nutritional Sciences and Dietetics, Tehran University of Medical Sciences (TUMS), Tehran, Iran
Keywords: Food-based dietary inflammatory index (FDII), Non-communicable diseases (NCDs), Iran, Food choice determinants.
Full-Text [PDF 931 kb]
(96 Downloads)
| Abstract (HTML) (856 Views)
Introduction
Anti-inflammatory food groups and pro-inflammatory food groups are presented in Table 2. As said previously, this study did not have information about alcoholic drinks or low-energy beverages, which define 3 food groups, so the calculation of FDII is based on 15 food groups (7 anti-inflammatories, 8 pro-inflammatory).
This study also modified the EDII to better reflect Iranian dietary patterns. For example, in Iran, fruits are consumed more commonly than natural fruit juices. This replacement in the Tabung EDII with the modified FDII could explain some percentage changes. Moreover, Esmailzadeh’s study established a relationship between fruits and inflammatory biomarkers such as TNF-alpha and interleukin-6. Unlike Margherita pizza in Western countries, pizza in Iran typically includes red meat, poultry, and processed meats, classifying it as a pro-inflammatory food in this study. Similarly, industrial snacks in Iran, made with sunflower oil and frying oils high in omega-6 and trans fats, were categorized as pro-inflammatory. Tomatoes, a vegetable consumed widely in Iran, were classified as anti-inflammatory based on Esmailzadeh’s findings (Esmaillzadeh et al., 2007).
The FDII among older age groups remains pro-inflammatory after 30 years, while in children under 5, there has been progress toward the consumption of anti-inflammatory foods. Children and physically active individuals require diets high in energy for growth and energy balance, often leading to the consumption of energy-dense, nutrient-sparse foods. Since energy intake is a component of the DII, this adds complexity to the findings (Shivappa et al., 2017, Wiecha et al., 2006).
This study revealed a significant association between the FDII score and household head age, total energy intake, and socioeconomic status over three decades. These findings align with previous research, indicating that older individuals tend to adopt less inflammatory dietary patterns, possibly due to increased health awareness or dietary restrictions associated with aging (Drewnowski and Fulgoni III, 2008). Conversely, higher energy intake is often linked to consumption of ultra-processed foods, saturated fats, and added sugars, all of which contribute to elevated dietary inflammation (Monteiro et al., 2019). Socioeconomic status plays a critical role in shaping dietary quality; households with higher SES typically have greater access to nutrient-rich foods and health-promoting dietary behaviors, resulting in lower FDII scores. The inverse relationship between SES and FDII underscores the need for targeted nutritional interventions in economically disadvantaged populations. Addressing structural barriers to healthy food access and promoting affordable anti-inflammatory dietary options may help mitigate diet-related health disparities (Hébert et al., 2014).
Research highlights both endogenous and non-endogenous risk factors influencing chronic inflammation, including chronic infections (Effros, 2016), lifestyle-induced obesity (Stout et al., 2017), microbiome dysbiosis (Franceschi et al., 2018), diet (Zitvogel et al., 2017), cultural changes (Razzoli et al., 2018), and environmental toxicants (Carroll et al., 2016). Similar trends in the U.S. show that males, non-Hispanic Blacks, younger adults, and those with less education tend to have higher DII scores, indicating greater inflammatory potential.
The present study had two main limitations:
Full-Text: (56 Views)
Food-based Dietary Inflammatory Index Trend and Dietary Inflammatory Index Determinants for the Period (1991–2021) in Iran
Elham Shareghfarid; PhD candidate1, Ahmadreza Dorosty Motlagh; PhD2*, Amirhossein Takian; MD, PhD3 &
Ahmad Esmaeilzadeh; PhD2
Elham Shareghfarid; PhD candidate1, Ahmadreza Dorosty Motlagh; PhD2*, Amirhossein Takian; MD, PhD3 &
Ahmad Esmaeilzadeh; PhD2
1 School of Nutritional Sciences and Dietetics, Tehran University of Medical Sciences (TUMS), Tehran, Iran; 2 Department of Community Nutrition, School of Nutritional Sciences and Dietetics, Tehran University of Medical Sciences (TUMS), Tehran, Iran; 3 Department of Global Health and Public Policy; & Department of Health Management, Policy & Economics; School of Public Health; Health Equity Research Center (HERC), Tehran University of Medical Sciences (TUMS); Tehran, Iran.
| ARTICLE INFO | ABSTRACT | |
| ORIGINAL ARTICLE | Background: Chronic systemic inflammation is a contributing factor to many chronic diseases. Diet affects the development and prevention of diseases. Moreover, Food-based Dietary Inflammatory Index (FDII) provides a classification for foods that scores a person's diet. Therefore, the aim of the present study is to provide an overall picture of the changes in the FDII in Iran, as well as factors associated with these changes, over the past three decades. Methods: This is a cross-sectional study. The Iranian Statistics Center (ISC) provided the purchase data obtained from the annual Household Income and Expenditure Survey. FDII was calculated based on 15 food groups (seven anti-inflammatory and eight pro-inflammatory). The authors plotted the inflammatory profile for the 30 years (1991–2021) to observe the changes in DII over different years. Results: This study showed there is an increased percentage of Iranians who currently consume a pro-inflammatory diet compared to three decades ago. Furthermore, FDII showed a higher anti-inflammatory food consumption rate as the age of the household head increased (r=0.68, P<0.001). Conversely, FDII indicated a higher inflammatory food consumption rate as the socioeconomic status score increased (r=-0.06, P<0.001). Thus, the authors observed a direct association between the total energy intake from the diet and the consumption of pro-inflammatory foods (r=0.11, P<0.001). Conclusion: This study revealed a strong association between the dietary inflammatory profile and recent dietary trends. The authors recommend calculating and plotting the trend of the dietary inflammatory profile for micronutrients for future studies. | |
| Article history: Received: 31 Jan 2026 Revised: 6 May 2026 Accepted: 6 May 2026 |
||
| *Corresponding author: dorostim@tums.ac.ir Department of Community Nutrition, School of Nutritional Sciences and Dietetics, Tehran University of Medical Sciences (TUMS), Tehran, Iran Postal code: 14155-6117 Tel: +98 2188955742-120 |
||
Keywords: Food-based dietary inflammatory index (FDII); Non-communicable diseases (NCDs); Iran; Food choice determinants. |
Introduction
Chronic inflammation refers to slow, long-term inflammation lasting for prolonged periods, from several months to years (Pahwa et al., 2021). Certain risk factors, including age, obesity, diet, smoking, low sex hormones, stress, and sleep disorders, promote a low-level inflammatory response (Kantor et al., 2013, Margină et al., 2020, Norde et al., 2020). Chronic inflammatory diseases are the most significant cause of death worldwide. Furthermore, untreated chronic inflammation generally carries a poor prognosis, which could be alleviated by improving diet.
Significant dietary influences have been established for the glycemic index and load, fiber, fatty acid composition, magnesium, carotenoids, and flavonoids. Traditional Mediterranean dietary patterns typically have a high ratio of monounsaturated to saturated fats and ω-3 to ω-6 polyunsaturated fatty acids. These patterns supply an abundance of fruits, vegetables, legumes, and grains and have shown anti-inflammatory effects when compared with typical North American and Northern European dietary patterns in most observational and interventional studies. Thus, they may become the diet of choice for diminishing chronic inflammation in clinical practice (Galland, 2010).
Dietary guidelines are not always based on the strongest empirical evidence and are subject to debate, controversy, and periodic change (DiNicolantonio et al., 2016). In contrast to other indices, the Dietary Inflammatory Index (DII) was designed to reflect all evidence from a wide variety of human populations using different study designs and dietary assessment methods. The DII evaluates the inflammatory potential of the diet from maximum anti-inflammatory food components to maximum pro-inflammatory food components (Shivappa et al., 2014, Tabung et al., 2016). Lower scores (more negative) indicate greater anti-inflammatory potential, while higher scores (more positive) show greater pro-inflammatory potential. Although a nutrient-based dietary inflammatory profile can identify the relationships between diet and chronic diseases, identifying the relationships between food intake and diseases is more effective for nutritional recommendations in the community to prevent non-communicable diseases.
The role of lifestyle in developing chronic inflammation was reflected in a study on 210 healthy twins aged between 8 and 82, showing that non-heritable factors are the strongest contributors to differences in chronic inflammation across individuals. The study also reported that exposure to environmental factors, is the primary driver of systemic chronic inflammation (Brodin et al., 2015). One study concluded that sociodemographic factors (age, location, and education), behavioral and lifestyle factors (cigarette smoking, alcohol intake, and hormone replacement therapy), obesity and fat distribution, and prevalent diabetes explain 13–30% of the inter-individual variability of these traits (Pankow et al., 2001). Moreover, the study indicated a consistent inverse association between socioeconomic position (SEP) and CRP across cohorts, where participants with a less advantaged SEP had higher levels of inflammation. Educational attainment was observed to be most strongly related to inflammation after adjusting for health behaviors, body mass index, and later-in-life SEP. These findings suggest a socioeconomic disadvantage in young adulthood, which is independently associated with later-life inflammation (Berger et al., 2019). The study also showed substantially decreased mean concentrations of CRP, Serum Amyloid A (SAA), and fibrinogen with increasing socioeconomic status (education and family income). The trends in CRP and fibrinogen remained statistically significant after adjusting for smoking, waist-to-hip ratio, and prevalent longstanding diseases (Jousilahti et al., 2003). Ultimately, male sex and increasing age were significant determinants of diet quality across BMI subgroups (Forbes et al., 2009).
Previous cross-sectional and case-control studies calculated DII to assess the relationship between DII and chronic disease (Hariharan et al., 2022, Marx et al., 2021, Patel et al., 2025). To the authors’ knowledge, no study has presented a general trend of Food-based Dietary Inflammatory Index (FDII) in the national and sub-national population. A cross-sectional study drew the DII score trend in the United States (US) (Ryu et al., 2019). In a recent study in the US, a significant quadratic trend was observed, with DII scores reaching their highest point in 2003–2004, followed by a decline across the survey cycles from 2005 to 2014. Comparable quadratic patterns were also evident across subgroups defined by age, gender, race/ethnicity, and educational level. Due to the western dietary pattern in the US, it is worth estimating the changes in the FDII score in the past 3 decades in Iran. Understanding long-term trends of inflammatory potential diet is essential for developing public health strategies aimed at preventing chronic diseases. Therefore, the present study aims to provide a comprehensive overview of the changes in the FDII across Iran, and to identify the socioeconomic factors associated with these variations over the past three decades.
Materials and Methods
Dietary data
This is a cross-sectional study. This study draws the FDII trend using household food expenditure data in Iran. The household-purchased food items were extracted from the annual survey of household income and expenditure conducted by the Iranian Statistics Center (ISC) from 1991 to 2021 (Statistical Center of Iran, 2022). Household expenditure and income surveys have also been conducted since 1963 for rural households and since 1968 for urban households.
The data collection duration spans from May 1 to April 30 of the following year. Data collection is performed through face-to-face interviews with sample households, during which a questionnaire is completed. The first-stage sampling framework in this project is the third basic sample of household statistics, which includes the primary sampling units (clusters). Each cluster comprises a block, part of a large block, in some cases, a group of smaller blocks based on the 2013 census data, ensuring each cluster contains at least 250 households. These samples are selected in three stages using probability sampling methods. The urban points in this plan include all areas with municipalities at the time of the 2015 population and housing census.
The ISC defines the expenditure as consumption of oneself or others, so if the food eaten was given to a servant, a sweeper, or a worker, it was not separated in the income expenditure data. Before the raw data was placed on the ISC’s website, the authors removed the household identification information. Therefore, the name of the head of the household, the address of the household, and their block could not be identified. The data related to the Iranian national households were included and the information related to the food cost of immigrants was deleted.
The household income and expenditure questionnaire was revised in 1991; hence, the authors extracted the information from 1991. The Household Income Expenditure Dataset collects information annually in four sections: household social characteristics, household housing facilities, household expenditures, and household incomes. This data includes the cost and quantity of food purchased for all common food items consumed by Iranian households. In addition to purchased food items, food received as gifts or aid during the past month is also included.
To calculate daily household intake, the total amount of food was divided by 30. To estimate the edible portion, a waste coefficient (e.g., 12% for fruits and vegetables) was used based on food type. Additionally, a loss coefficient for live domestic food items, such as live lamb and poultry, was applied. These coefficients were provided by the Food and Agriculture Organization for middle-income countries (Gustafsson et al., 2013). Cooking coefficients, which reflect the weight of food items after cooking, were also applied to relevant food items.
Purchased foods were divided into two categories:
Significant dietary influences have been established for the glycemic index and load, fiber, fatty acid composition, magnesium, carotenoids, and flavonoids. Traditional Mediterranean dietary patterns typically have a high ratio of monounsaturated to saturated fats and ω-3 to ω-6 polyunsaturated fatty acids. These patterns supply an abundance of fruits, vegetables, legumes, and grains and have shown anti-inflammatory effects when compared with typical North American and Northern European dietary patterns in most observational and interventional studies. Thus, they may become the diet of choice for diminishing chronic inflammation in clinical practice (Galland, 2010).
Dietary guidelines are not always based on the strongest empirical evidence and are subject to debate, controversy, and periodic change (DiNicolantonio et al., 2016). In contrast to other indices, the Dietary Inflammatory Index (DII) was designed to reflect all evidence from a wide variety of human populations using different study designs and dietary assessment methods. The DII evaluates the inflammatory potential of the diet from maximum anti-inflammatory food components to maximum pro-inflammatory food components (Shivappa et al., 2014, Tabung et al., 2016). Lower scores (more negative) indicate greater anti-inflammatory potential, while higher scores (more positive) show greater pro-inflammatory potential. Although a nutrient-based dietary inflammatory profile can identify the relationships between diet and chronic diseases, identifying the relationships between food intake and diseases is more effective for nutritional recommendations in the community to prevent non-communicable diseases.
The role of lifestyle in developing chronic inflammation was reflected in a study on 210 healthy twins aged between 8 and 82, showing that non-heritable factors are the strongest contributors to differences in chronic inflammation across individuals. The study also reported that exposure to environmental factors, is the primary driver of systemic chronic inflammation (Brodin et al., 2015). One study concluded that sociodemographic factors (age, location, and education), behavioral and lifestyle factors (cigarette smoking, alcohol intake, and hormone replacement therapy), obesity and fat distribution, and prevalent diabetes explain 13–30% of the inter-individual variability of these traits (Pankow et al., 2001). Moreover, the study indicated a consistent inverse association between socioeconomic position (SEP) and CRP across cohorts, where participants with a less advantaged SEP had higher levels of inflammation. Educational attainment was observed to be most strongly related to inflammation after adjusting for health behaviors, body mass index, and later-in-life SEP. These findings suggest a socioeconomic disadvantage in young adulthood, which is independently associated with later-life inflammation (Berger et al., 2019). The study also showed substantially decreased mean concentrations of CRP, Serum Amyloid A (SAA), and fibrinogen with increasing socioeconomic status (education and family income). The trends in CRP and fibrinogen remained statistically significant after adjusting for smoking, waist-to-hip ratio, and prevalent longstanding diseases (Jousilahti et al., 2003). Ultimately, male sex and increasing age were significant determinants of diet quality across BMI subgroups (Forbes et al., 2009).
Previous cross-sectional and case-control studies calculated DII to assess the relationship between DII and chronic disease (Hariharan et al., 2022, Marx et al., 2021, Patel et al., 2025). To the authors’ knowledge, no study has presented a general trend of Food-based Dietary Inflammatory Index (FDII) in the national and sub-national population. A cross-sectional study drew the DII score trend in the United States (US) (Ryu et al., 2019). In a recent study in the US, a significant quadratic trend was observed, with DII scores reaching their highest point in 2003–2004, followed by a decline across the survey cycles from 2005 to 2014. Comparable quadratic patterns were also evident across subgroups defined by age, gender, race/ethnicity, and educational level. Due to the western dietary pattern in the US, it is worth estimating the changes in the FDII score in the past 3 decades in Iran. Understanding long-term trends of inflammatory potential diet is essential for developing public health strategies aimed at preventing chronic diseases. Therefore, the present study aims to provide a comprehensive overview of the changes in the FDII across Iran, and to identify the socioeconomic factors associated with these variations over the past three decades.
Materials and Methods
Dietary data
This is a cross-sectional study. This study draws the FDII trend using household food expenditure data in Iran. The household-purchased food items were extracted from the annual survey of household income and expenditure conducted by the Iranian Statistics Center (ISC) from 1991 to 2021 (Statistical Center of Iran, 2022). Household expenditure and income surveys have also been conducted since 1963 for rural households and since 1968 for urban households.
The data collection duration spans from May 1 to April 30 of the following year. Data collection is performed through face-to-face interviews with sample households, during which a questionnaire is completed. The first-stage sampling framework in this project is the third basic sample of household statistics, which includes the primary sampling units (clusters). Each cluster comprises a block, part of a large block, in some cases, a group of smaller blocks based on the 2013 census data, ensuring each cluster contains at least 250 households. These samples are selected in three stages using probability sampling methods. The urban points in this plan include all areas with municipalities at the time of the 2015 population and housing census.
The ISC defines the expenditure as consumption of oneself or others, so if the food eaten was given to a servant, a sweeper, or a worker, it was not separated in the income expenditure data. Before the raw data was placed on the ISC’s website, the authors removed the household identification information. Therefore, the name of the head of the household, the address of the household, and their block could not be identified. The data related to the Iranian national households were included and the information related to the food cost of immigrants was deleted.
The household income and expenditure questionnaire was revised in 1991; hence, the authors extracted the information from 1991. The Household Income Expenditure Dataset collects information annually in four sections: household social characteristics, household housing facilities, household expenditures, and household incomes. This data includes the cost and quantity of food purchased for all common food items consumed by Iranian households. In addition to purchased food items, food received as gifts or aid during the past month is also included.
To calculate daily household intake, the total amount of food was divided by 30. To estimate the edible portion, a waste coefficient (e.g., 12% for fruits and vegetables) was used based on food type. Additionally, a loss coefficient for live domestic food items, such as live lamb and poultry, was applied. These coefficients were provided by the Food and Agriculture Organization for middle-income countries (Gustafsson et al., 2013). Cooking coefficients, which reflect the weight of food items after cooking, were also applied to relevant food items.
Purchased foods were divided into two categories:
- Food items purchased outside the home but consumed at home (e.g., soft drinks and juices).
- Food items purchased and consumed outside the home (e.g., meals from restaurants or hotels).
To convert the total cost of food into quantities purchased, the price of food was required. Since food prices were not recorded in the dataset, average city-level prices published monthly by the ISC were used for beverages and juices. For food purchased and consumed outside the home, the average of the lowest total value reported by three households from urban and rural areas was considered the price of a meal. These values were then converted into food components based on Iranian diets. Provincial price differences were not considered due to the minimal variation in food prices within the country.
A comparison of household food expenditure surveys with food intake data showed a 70% correlation between the two datasets (Brewster et al., 2019).
The raw data underwent cleaning in four steps:
1.Removing households with duplicate information recorded by two interviewers.
2.Removing incorrectly recorded data.
3.Removing households with energy intake below 450 kcal (121, 122) or above 4500 kcal (123).
4.Removing outlier food items.
Food-based DII calculation
To calculate the FDII for individuals, the amount of food consumed by the entire household was distributed among household members using the adult male equivalent coefficient. These coefficients were determined based on the age-group energy requirements of Iranians. Food composition data were obtained from the England Food Composition Table, and the Dorosty Food Processor (DFP) software was used to analyze food composition (Dorosty, 2003). Finally, the weight and energy content of each food item consumed by each individual per day were entered into SPSS software version 20 for further analysis.
To calculate the FDII, the average daily expenditure for 15 predetermined food groups was assessed. These included:
1. Anti-inflammatory food groups: fruit juices, fish, yellow vegetables, green leafy vegetables, tomato, tea, and coffee.
2. Pro-inflammatory food groups: processed meats, red meat, organ meat, other vegetables, refined grains, pizza, snacks, and high-energy beverages.
The FDII score was obtained by multiplying the amounts of each food group by the EDII scores and weights determined in the Tabung study (Tabung et al., 2016). The overall dietary inflammatory score for each person was calculated by summing the scores of all food groups. Additionally, the average dietary inflammatory index score for individuals in each province was calculated. To account for changes in administrative divisions, province-level FDII scores were presented based on the latest updates in 2016.
The validity of this index has been demonstrated in previous research using a multivariable linear regression model. In two independent samples from the NHS-II study (1002 participants) and HPFS study (2632 participants), the DII index successfully predicted concentrations of IL-6, CRP, TNF-α, and adiponectin, thereby validating its ability to estimate the total inflammatory biomarker score (Hankinson et al., 1995). Due to the dietary differences between Iran and Western countries, certain foods in the EDII model designed by Tabung (Tabung et al., 2016) (e.g., margarita pizza) are not commonly consumed in Iranian food culture. In this study, the dietary inflammatory index was modified for Iran by referring to the proven relationships between foods commonly consumed in Iran as reported in Esmailzadeh's study (Esmaillzadeh et al., 2007). For FDII development, the authors used their previous dataset on 486 Tehran female teachers, in which foods and food groups contributing to systemic inflammation were reported. In that study, systemic inflammation was assessed by measuring serum concentrations of hs-CRP, IL-6, and TNF-alpha. Foods and food groups loaded in the healthy dietary pattern of that study were considered anti-inflammatory, and those loaded in the western dietary pattern were considered pro-inflammatory. This was done due to the inverse association the authors found between a healthy dietary pattern and inflammation and a positive association between a western dietary pattern and inflammation (Esmaillzadeh et al., 2007).
To generalize these calculations from households and individuals to the entire society, a weighted average of food groups was used. The formula involved multiplying the individual or household intake of each food group by the household weight and dividing by the total weight of all households in each province.
Socio-economic status
In the Household Income and Expenditure Survey conducted by the Statistical Center of Iran, data on household members-including income, education, employment type, marital status, occupation, age, and gender-are recorded by trained interviewers.
To assess households' economic status, two approaches are commonly used: (1) total household income, calculated as the sum of all members' earnings, and (2) household assets and facilities, which reflect economic well-being.
Social status was evaluated based on the educational level of the household head, categorized according to the International Standard Classification of Education (ISCED) classification system.
As previously noted, to refine and weight the socioeconomic indicators derived from the questionnaire, interviews were conducted with five nutrition experts. Participants were asked to rate households on a scale from 1 (lowest socioeconomic status) to 10 (highest), based on their professional judgment (Supplementary file).
The research study protocol was approved by Tehran University Medical Sciences under the ethical code IR.TUMS.MEDICINE.REC.1401.031.
A comparison of household food expenditure surveys with food intake data showed a 70% correlation between the two datasets (Brewster et al., 2019).
The raw data underwent cleaning in four steps:
1.Removing households with duplicate information recorded by two interviewers.
2.Removing incorrectly recorded data.
3.Removing households with energy intake below 450 kcal (121, 122) or above 4500 kcal (123).
4.Removing outlier food items.
Food-based DII calculation
To calculate the FDII for individuals, the amount of food consumed by the entire household was distributed among household members using the adult male equivalent coefficient. These coefficients were determined based on the age-group energy requirements of Iranians. Food composition data were obtained from the England Food Composition Table, and the Dorosty Food Processor (DFP) software was used to analyze food composition (Dorosty, 2003). Finally, the weight and energy content of each food item consumed by each individual per day were entered into SPSS software version 20 for further analysis.
To calculate the FDII, the average daily expenditure for 15 predetermined food groups was assessed. These included:
1. Anti-inflammatory food groups: fruit juices, fish, yellow vegetables, green leafy vegetables, tomato, tea, and coffee.
2. Pro-inflammatory food groups: processed meats, red meat, organ meat, other vegetables, refined grains, pizza, snacks, and high-energy beverages.
The FDII score was obtained by multiplying the amounts of each food group by the EDII scores and weights determined in the Tabung study (Tabung et al., 2016). The overall dietary inflammatory score for each person was calculated by summing the scores of all food groups. Additionally, the average dietary inflammatory index score for individuals in each province was calculated. To account for changes in administrative divisions, province-level FDII scores were presented based on the latest updates in 2016.
The validity of this index has been demonstrated in previous research using a multivariable linear regression model. In two independent samples from the NHS-II study (1002 participants) and HPFS study (2632 participants), the DII index successfully predicted concentrations of IL-6, CRP, TNF-α, and adiponectin, thereby validating its ability to estimate the total inflammatory biomarker score (Hankinson et al., 1995). Due to the dietary differences between Iran and Western countries, certain foods in the EDII model designed by Tabung (Tabung et al., 2016) (e.g., margarita pizza) are not commonly consumed in Iranian food culture. In this study, the dietary inflammatory index was modified for Iran by referring to the proven relationships between foods commonly consumed in Iran as reported in Esmailzadeh's study (Esmaillzadeh et al., 2007). For FDII development, the authors used their previous dataset on 486 Tehran female teachers, in which foods and food groups contributing to systemic inflammation were reported. In that study, systemic inflammation was assessed by measuring serum concentrations of hs-CRP, IL-6, and TNF-alpha. Foods and food groups loaded in the healthy dietary pattern of that study were considered anti-inflammatory, and those loaded in the western dietary pattern were considered pro-inflammatory. This was done due to the inverse association the authors found between a healthy dietary pattern and inflammation and a positive association between a western dietary pattern and inflammation (Esmaillzadeh et al., 2007).
To generalize these calculations from households and individuals to the entire society, a weighted average of food groups was used. The formula involved multiplying the individual or household intake of each food group by the household weight and dividing by the total weight of all households in each province.
Socio-economic status
In the Household Income and Expenditure Survey conducted by the Statistical Center of Iran, data on household members-including income, education, employment type, marital status, occupation, age, and gender-are recorded by trained interviewers.
To assess households' economic status, two approaches are commonly used: (1) total household income, calculated as the sum of all members' earnings, and (2) household assets and facilities, which reflect economic well-being.
Social status was evaluated based on the educational level of the household head, categorized according to the International Standard Classification of Education (ISCED) classification system.
As previously noted, to refine and weight the socioeconomic indicators derived from the questionnaire, interviews were conducted with five nutrition experts. Participants were asked to rate households on a scale from 1 (lowest socioeconomic status) to 10 (highest), based on their professional judgment (Supplementary file).
The research study protocol was approved by Tehran University Medical Sciences under the ethical code IR.TUMS.MEDICINE.REC.1401.031.
Data analysis
Since there is no established biological cutoff for the inflammatory profile of diets based on experimental methods, the countrywide inflammatory profile from the past 30 years was divided into quartiles. These quartiles were used to determine the cut points for categorizing diets into pro-inflammatory, anti-inflammatory, and moderately inflammatory profiles. An ANOVA test was performed to evaluate the difference between quartiles in continuous variables, and the chi-square test was used for categorical variables. Pearson’s correlation coefficient was employed to evaluate the linear association between the Dietary Inflammatory Index (DII) score-a continuous variable-and the age of the household head (years), total energy intake (calories), and socioeconomic status (score). Analyses were performed with SPSS software (version 20; SPSS Inc.). Trends were then performed for age subgroups. Finally, a two-tailed p-value of less than 0.05 was considered statistically significant.
Results
After calculating the inflammatory index score in the 30 years studied in 2006 due to the high number of people whose dietary information was not recorded in quantitative form, and 1996 and 1997 due to the unreality of the obtained dietary inflammatory index score compared to the years before and after they were excluded from the study to draw the trend, study sample size is shown in Table 1.
Results
After calculating the inflammatory index score in the 30 years studied in 2006 due to the high number of people whose dietary information was not recorded in quantitative form, and 1996 and 1997 due to the unreality of the obtained dietary inflammatory index score compared to the years before and after they were excluded from the study to draw the trend, study sample size is shown in Table 1.
| Table 1. Study sample size (from 1991 to 2021). | |
| Year | Sample size |
| 1991 | 83837 |
| 1992 | 80582 |
| 1993 | 55117 |
| 1994 | 89926 |
| 1995 | 162551 |
| 1998 | 71680 |
| 1999 | 118215 |
| 2000 | 112469 |
| 2001 | 110023 |
| 2002 | 125596 |
| 2003 | 88103 |
| 2004 | 86807 |
| 2005 | 94272 |
| 2007 | 108796 |
| 2008 | 136512 |
| 2009 | 126779 |
| 2010 | 128531 |
| 2011 | 129832 |
| 2012 | 126998 |
| 2013 | 123229 |
| 2014 | 134729 |
| 2015 | 125113 |
| 2016 | 124112 |
| 2017 | 122624 |
| 2,018 | 124507 |
| 2019 | 122489 |
| 2020 | 326497 |
| 2021 | 121399 |
Anti-inflammatory food groups and pro-inflammatory food groups are presented in Table 2. As said previously, this study did not have information about alcoholic drinks or low-energy beverages, which define 3 food groups, so the calculation of FDII is based on 15 food groups (7 anti-inflammatories, 8 pro-inflammatory).
| Table 2. Food groupings and food items by food expenditure survey in Iran. | |
| Food groups | Food items |
| Pro-inflammatory diet | |
| Red meat | Lamb, beef, camel, hamburger |
| Organ meat | Beef, lamb, chicken, and turkey liver, heart, and kidney |
| Refined grain |
White bread, starch, English muffins, bagels or rolls, muffins or biscuits, white rice, pasta, vermicelli, wheat flour |
| Processed meat | bacon, hot dogs |
| Other vegetable | Celery, mushrooms, green pepper, corn, mixed vegetables, eggplant, summer squash |
| Other fish | Canned tuna fish, dark-meat fish, smoked fish, shrimp, and scallops |
| Low-energy beverages | Industrial fruit juice, soda, concentrated syrup |
| Pizza | pizza |
| Anti-inflammatory diet | |
| Tea | Tea |
| Coffee | Coffee |
| Fruit juice | Canned fruit |
| Tomato | Tomato, tomato sauce |
| Snack | Potato chips, corn chips |
| Dark yellow vegetables | Carrots |
| Leafy green vegetables | Spinach, lettuce |
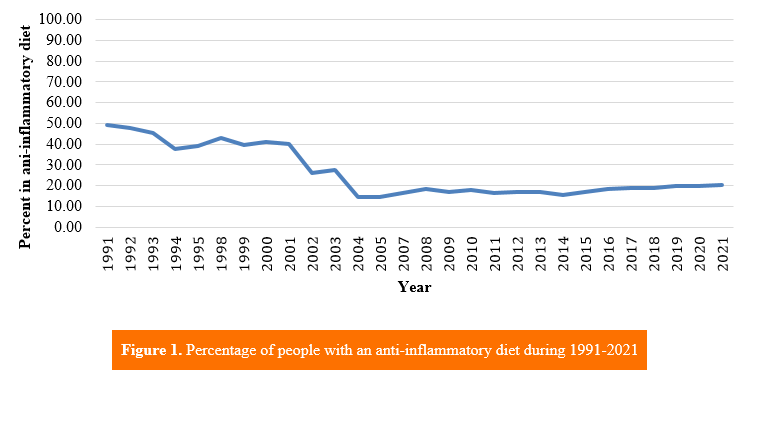
As shown in Figure 1, the percentage of people with an anti-inflammatory diet trend decreased from 1991 (49%); however, it has improved since 2004 (14%). The rate of people with an anti-inflammatory diet has steadily increased from 2016 to 2021 (18% to 20%).
As presented in Table 3, people in 2021 were older compared to the first year of the survey. The distribution of males and females was almost equal. Most of the Iranian population has elementary degrees. In the final year of the study period (2021), the proportion of individuals with higher educational attainment was greater than that observed three decades earlier. As expected, the percentage of illiteracy compared to literacy has become lower in recent years. The percentage of married people is the most common marital status in the last 3 decades. However, the number of widows and divorced people increased in 2011 and 2021.
Table 4 shows that the age of the head of the household, the total energy intake, and the
socio-economic status of the household are significantly associated with the FDII. For example, for the last year of survey, there is a significant association (r=0.64, P<0.001, r=-0.06, P<0.001, r=0.11, P<0.001). These factors have been significant in all 4 decades of the study. As the age of the head of the household increases, the FDII score decreases (r= -0.13, P<0.001 from 1991 till 2021, r= -0.06, P<0.001). With an increase in total energy intake, the FDII also increases. The score of the FDII decreases with the increase in the socioeconomic status score of the household (r=0.06, P<0.001 from 1991 till 2021, r=0.11, P<0.001).
Discussion
In the present study, the authors tried to calculate FDII using expenditure data. Additionally, this study modified the FDII to align with Iranian dietary patterns.
As shown in Figure 2, the percentage of people with an anti-inflammatory diet has decreased from 1991 (49%), reaching its lowest point in 2004 (14%). However, this trend improved steadily between 2016 and 2021, increasing from 18% to 20%. The results indicate that in Iran, the dietary inflammatory index was less anti-inflammatory during 1990–2002, reaching its lowest point in 2002–2003, and becoming more pro-inflammatory thereafter.
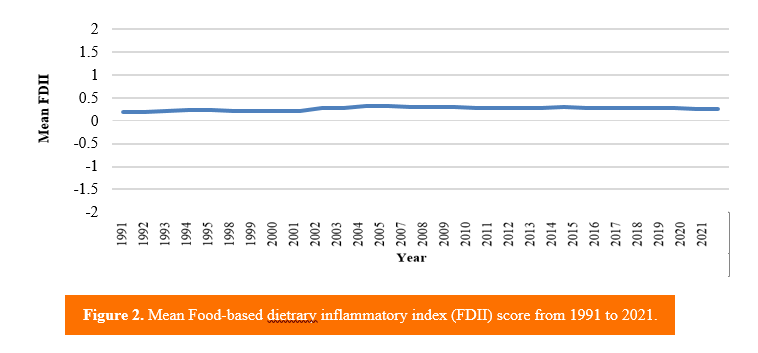
Contrary to the expectation that people in high-income countries consume more anti-inflammatory diets than those in low- and middle-income countries, this study shows a similar trend. The dietary patterns of society are influenced by various factors, including economic policies, government attention to dietary counseling in primary healthcare centers, advertising for pro-inflammatory foods, and subsidy reductions. The sharp decrease in anti-inflammatory food consumption in 2003 may be attributed to such factors. Although the mean FDII trend appears stable, this average masks the simultaneous increase in both anti-inflammatory and pro-inflammatory food consumption, leading to no significant overall change in the mean trend (see inflammatory foods chart).
Table 4 shows that the age of the head of the household, the total energy intake, and the
socio-economic status of the household are significantly associated with the FDII. For example, for the last year of survey, there is a significant association (r=0.64, P<0.001, r=-0.06, P<0.001, r=0.11, P<0.001). These factors have been significant in all 4 decades of the study. As the age of the head of the household increases, the FDII score decreases (r= -0.13, P<0.001 from 1991 till 2021, r= -0.06, P<0.001). With an increase in total energy intake, the FDII also increases. The score of the FDII decreases with the increase in the socioeconomic status score of the household (r=0.06, P<0.001 from 1991 till 2021, r=0.11, P<0.001).
Discussion
In the present study, the authors tried to calculate FDII using expenditure data. Additionally, this study modified the FDII to align with Iranian dietary patterns.
As shown in Figure 2, the percentage of people with an anti-inflammatory diet has decreased from 1991 (49%), reaching its lowest point in 2004 (14%). However, this trend improved steadily between 2016 and 2021, increasing from 18% to 20%. The results indicate that in Iran, the dietary inflammatory index was less anti-inflammatory during 1990–2002, reaching its lowest point in 2002–2003, and becoming more pro-inflammatory thereafter.
Contrary to the expectation that people in high-income countries consume more anti-inflammatory diets than those in low- and middle-income countries, this study shows a similar trend. The dietary patterns of society are influenced by various factors, including economic policies, government attention to dietary counseling in primary healthcare centers, advertising for pro-inflammatory foods, and subsidy reductions. The sharp decrease in anti-inflammatory food consumption in 2003 may be attributed to such factors. Although the mean FDII trend appears stable, this average masks the simultaneous increase in both anti-inflammatory and pro-inflammatory food consumption, leading to no significant overall change in the mean trend (see inflammatory foods chart).
| Table 3. Demographic characteristics of people across the household expenditure survey (1991-2021; N = 3160545). | ||||
| Characteristics | 1991 (n = 83837) | 2001 (n =110023) | 2011 (n =129832) | 2021 (n = 121399) |
| Age (year) | 24.00±19.47a | 26.00±18.00 | 31.00±19.70 | 34.00±20.76 |
| Gender | ||||
| Male | 40903 (48.79)b | 53008 (48.18) | 62331 (48.01) | 60253 (49.63) |
| Female | 42937 (51.21) | 57015 (51.82) | 67501 (51.99) | 61146 (50.37) |
| Education | ||||
| Illiterate | 33387 (39.82) | 34441 (31.30) | 33013 (25.43) | 0 |
| Elementary school | 30430 (36.30) | 31298 (28.45) | 37764 (29.09) | 37082 (38.17) |
| Lower secondary education | 10262 (12.24) |
19785 (17.98) |
21270 (16.38) |
19986 (20.57) |
| High school | 7252 (8.65) | 7806 (7.09) | 24142 (18.59) | 5523 (5.69) |
| Pre -university | 68 (0.08) | 11264 (10.24) | 0 | 18708 (19.26) |
| Other universities | 1189 (1.42) | 951 (0.86) | 584 (045) | 525 (0.54) |
| Diploma | 481 (0.57) | 1205 (1.10) | 12992 (10.01) | 3231 (3.33) |
| Bachelor’s degree | 663 (0.79) | 2851 (2.59) | 67 (0.05) | 10002 (10.30) |
| Master’s degree | 44 (0.05) | 248 (0.23) | 0 | 1963 (2.02) |
| PhD degree | 64 (0.08) | 174 (0.16) | 0 | 127 (0.13) |
| Literacy | ||||
| Illiterate | 22036 (30.40) | 23481 (23) | 23870 (19.74) | 16632 (14.62) |
| literate | 50453 (69.60) | 78608 (77) | 97046 (80.26) | 97147 (85.38) |
| Marital status | ||||
| Widow | 2742 (4.55) | 3362 (3.67) | 4929 (4.39) | 5443 (5.18) |
| Divorced | 228 (0.38) | 330 (0.36) | 878 (0.78) | 1452 (1.38) |
| Single | 26684 (44.28) | 43799 (47.85) | 44240 (39.36) | 35292 (33.61) |
| Married | 30610 (50.79) | 44038 (48.11) | 62350 (55.47) | 62806 (59.82) |
| a: Mean±SD, b: N(%). | ||||
| Table 4. Correlation of household determinants with mean Food-based dietrary inflammatory index (FDII)during 4 decades in Iran. | ||||||||||||
| Variables | 1991 | 2000 | 2010 | 2021 | ||||||||
| SD | r | P-value | SD | r | P-value | SD | r | P-value | SD | r | P-value | |
| Total energy intake | 901 | 0.48 | <0.001 | 853 | 0.42 | <0.001 | 866 | 0.67 | <0.001 | 981 | 0.68 | <0.001 |
| Age of the head of household | 14 | -0.13 | <0.001 | 14 | -0.12 | <0.001 | 14 | -0.95 | <0.001 | 15 | -0.06 | <0.001 |
| Socioeconomic status | 6.5 | 0.06 | <0.001 | 7.8 | 0.1 | <0.001 | 7.4 | 0.10 | <0.001 | 7.8 | 0.11 | <0.001 |
This study also modified the EDII to better reflect Iranian dietary patterns. For example, in Iran, fruits are consumed more commonly than natural fruit juices. This replacement in the Tabung EDII with the modified FDII could explain some percentage changes. Moreover, Esmailzadeh’s study established a relationship between fruits and inflammatory biomarkers such as TNF-alpha and interleukin-6. Unlike Margherita pizza in Western countries, pizza in Iran typically includes red meat, poultry, and processed meats, classifying it as a pro-inflammatory food in this study. Similarly, industrial snacks in Iran, made with sunflower oil and frying oils high in omega-6 and trans fats, were categorized as pro-inflammatory. Tomatoes, a vegetable consumed widely in Iran, were classified as anti-inflammatory based on Esmailzadeh’s findings (Esmaillzadeh et al., 2007).
The FDII among older age groups remains pro-inflammatory after 30 years, while in children under 5, there has been progress toward the consumption of anti-inflammatory foods. Children and physically active individuals require diets high in energy for growth and energy balance, often leading to the consumption of energy-dense, nutrient-sparse foods. Since energy intake is a component of the DII, this adds complexity to the findings (Shivappa et al., 2017, Wiecha et al., 2006).
This study revealed a significant association between the FDII score and household head age, total energy intake, and socioeconomic status over three decades. These findings align with previous research, indicating that older individuals tend to adopt less inflammatory dietary patterns, possibly due to increased health awareness or dietary restrictions associated with aging (Drewnowski and Fulgoni III, 2008). Conversely, higher energy intake is often linked to consumption of ultra-processed foods, saturated fats, and added sugars, all of which contribute to elevated dietary inflammation (Monteiro et al., 2019). Socioeconomic status plays a critical role in shaping dietary quality; households with higher SES typically have greater access to nutrient-rich foods and health-promoting dietary behaviors, resulting in lower FDII scores. The inverse relationship between SES and FDII underscores the need for targeted nutritional interventions in economically disadvantaged populations. Addressing structural barriers to healthy food access and promoting affordable anti-inflammatory dietary options may help mitigate diet-related health disparities (Hébert et al., 2014).
Research highlights both endogenous and non-endogenous risk factors influencing chronic inflammation, including chronic infections (Effros, 2016), lifestyle-induced obesity (Stout et al., 2017), microbiome dysbiosis (Franceschi et al., 2018), diet (Zitvogel et al., 2017), cultural changes (Razzoli et al., 2018), and environmental toxicants (Carroll et al., 2016). Similar trends in the U.S. show that males, non-Hispanic Blacks, younger adults, and those with less education tend to have higher DII scores, indicating greater inflammatory potential.
The present study had two main limitations:
- It relied on purchase data to calculate the dietary inflammatory profile, which is less precise than 24-hour recalls or food frequency questionnaires in estimating individual intake. This should be considered a proxy for dietary exposure. Although the findings of the FDII trend and its fluctuation are valid and the score during 40 years is comparable. 2) The inflammatory profile trend cannot be based on Shivappa’s DII, as it lacks precise information on nutrient intake.
The strengths of this study included its ability to track the inflammatory profile annually and detect small changes in community dietary habits. The large sample size, representing diverse climates across Iran’s regions, ensures that the calculated inflammatory profile accurately reflects the nation’s dietary patterns. Moreover, the FDII was modified to align with the dietary habits and food compositions specific to Iran.
Conclusions
This study indicates that the trend in the percentage of people with an anti-inflammatory diet in Iran over the last three decades has not followed a consistent pattern. Policymaking studies are recommended to promote the consumption of anti-inflammatory foods. Additionally, calculating and visualizing the inflammatory profile based on micronutrients using the Shivappa method would provide a more detailed view of micronutrient intake from an inflammatory perspective. Future research should also investigate the environmental, physiological, and political factors influencing the inflammatory profile of diets.
Acknowledgements
The authors acknowledge the Statistical Center of Iran for providing access to the data used in this study.
Authors' contributions
Conceptualization: The core research idea was conceptualized and developed by Dorosty motlagh A, Methodology: The statistical analysis was developed by Shareghfarid E in collaboration with Dorosty motlagh A. The overall study design was developed collaboratively by all authors. Supervision: Takian A and Dorosty motlagh A supervised and conceived the study. Writing original draft: Shareghfarid E drafted the manuscript. Writing review and editing: Takian A and Dorosty motlagh A critically reviewed the manuscript and suggested revisions and approved the final draft. The revisions were implemented by Shareghfarid E.
Conflict of Interest
The authors declared no conflict of interest.
Funding
No funding was received to support
References
Berger E, et al. 2019. Multi-cohort study identifies social determinants of systemic inflammation over the life course. In Nature communications, pp. 1-10.
Brewster PJ, Durward CM, Hurdle JF, Stoddard GJ & Guenther PM 2019. The grocery purchase quality index-2016 performs similarly to the healthy eating index-2015 in a national survey of household food purchases. Journal of the Academy of Nutrition and Dietetics. 119 (1): 45-56.
Brodin P, et al. 2015. Variation in the human immune system is largely driven by non-heritable influences. Cell. 160 (1-2): 37-47.
Carroll JE, et al. 2016. Partial sleep deprivation activates the DNA damage response (DDR) and the senescence-associated secretory phenotype (SASP) in aged adult humans. Brain, behavior, and immunity. 51: 223-229.
DiNicolantonio JJ, Harcombe Z & O’Keefe JH 2016. Problems with the 2015 dietary guidelines for Americans: An alternative. Missouri medicine. 113 (2): 93.
Dorosty A 2003. Iranian Food Composition Software. Tehran, School of Public Health, Tehran University of Medical Sciences.
Drewnowski A & Fulgoni III V 2008. Nutrient profiling of foods: creating a nutrient-rich food index. Nutrition reviews. 66 (1): 23-39.
Effros RB 2016. The silent war of CMV in aging and HIV infection. Mechanisms of ageing and development. 158: 46-52.
Esmaillzadeh A, et al. 2007. Dietary patterns and markers of systemic inflammation among Iranian women. Journal of nutrition. 137 (4): 992-998.
Forbes LJ, et al. 2009. Chronic exposure to outdoor air pollution and markers of systemic inflammation. Epidemiology. 20 (2): 245-253.
Franceschi C, Garagnani P, Parini P, Giuliani C & Santoro A 2018. Inflammaging: a new immune–metabolic viewpoint for age-related diseases. Nature reviews endocrinology. 14 (10): 576-590.
Galland L 2010. Diet and inflammation. Nutrition in clinical practice. 25 (6): 634-640.
Gustafsson J, Cederberg C, Sonesson U & Emanuelsson A 2013. The methodology of the FAO study: Global food losses and food waste-extent, causes and prevention”-FAO, 2011. The Swedish Institute for Food and Biotechnology: Swedish
Hankinson SE, et al. 1995. Alcohol, height, and adiposity in relation to estrogen and prolactin levels in postmenopausal women. Journal of the national cancer institute. 87 (17): 1297-1302.
Hariharan R, et al. 2022. The dietary inflammatory index, obesity, type 2 diabetes, and cardiovascular risk factors and diseases. Obesity reviews. 23 (1): e13349.
Hébert JR, et al. 2014. On the use of the dietary inflammatory index in relation to low-grade inflammation and markers of glucose metabolism in the Cohort study on Diabetes and Atherosclerosis Maastricht (CODAM) and the Hoorn study. American journal of clinical nutrition. 99 (6): 1520.
Jousilahti P, Salomaa V, Rasi V, Vahtera E & Palosuo T 2003. Association of markers of systemic inflammation, C reactive protein, serum amyloid A, and fibrinogen, with socioeconomic status. Journal of epidemiology & community health. 57 (9): 730-733.
Kantor ED, Lampe JW, Kratz M & White E 2013. Lifestyle factors and inflammation: associations by body mass index. PloS one. 8 (7): e67833.
Margină D, et al. 2020. Chronic inflammation in the context of everyday life: dietary changes as mitigating factors. International journal of environmental research and public health. 17 (11): 4135.
Marx W, et al. 2021. The dietary inflammatory index and human health: An umbrella review of meta-analyses of observational studies. Advanced nutrition. 12 (5): 1681-1690.
Monteiro CA, et al. 2019. Ultra-processed foods: what they are and how to identify them. Public health nutrition. 22 (5): 936-941.
Norde MM, Fisberg RM, Marchioni DM & Rogero MM 2020. Systemic low-grade inflammation–associated lifestyle, diet, and genetic factors: a population-based cross-sectional study. Nutrition. 70: 110596.
Pahwa R, Goyal A & Jialal I 2021. Chronic inflammation.
Pankow JS, et al. 2001. Familial and genetic determinants of systemic markers of inflammation: the NHLBI family heart study. Atherosclerosis. 154 (3): 681-689.
Patel I, Tang X, Song Z & Zhou J 2025. Relationship between dietary inflammatory index and chronic diseases in older U.S. Adults: NHANES 1999-2018. BMC public health. 25 (1): 1498.
Razzoli M, et al. 2018. Social stress shortens lifespan in mice. Aging cell. 17 (4): e12778.
Ryu S, et al. 2019. Secular trends in Dietary Inflammatory Index among adults in the United States, 1999–2014. European journal of clinical nutrition. 73 (10): 1343-1351.
Shivappa N, et al. 2017. Association between dietary inflammatory index and inflammatory markers in the HELENA study. Molecular nutrition & food research. 61 (6): 1600707.
Shivappa N, Steck SE, Hurley TG, Hussey JR & Hébert JR 2014. Designing and developing a literature-derived, population-based dietary inflammatory index. Public health nutrition. 17 (8): 1689-1696.
Statistical Center of Iran 2022. Iran household, expenditure and income, https://amar.org.ir/english.
Stout MB, Justice JN, Nicklas BJ & Kirkland JL 2017. Physiological aging: links among adipose tissue dysfunction, diabetes, and frailty. Physiology. 32 (1): 9-19.
Tabung FK, et al. 2016. Development and validation of an empirical dietary inflammatory index. Journal of nutrition. 146 (8): 1560-1570.
Wiecha JL, et al. 2006. When children eat what they watch: impact of television viewing on dietary intake in youth. Archives of pediatrics & adolescent medicine. 160 (4): 436-442.
Zitvogel L, Pietrocola F & Kroemer G 2017. Nutrition, inflammation and cancer. Nature immunology. 18 (8): 843-850.
Conclusions
This study indicates that the trend in the percentage of people with an anti-inflammatory diet in Iran over the last three decades has not followed a consistent pattern. Policymaking studies are recommended to promote the consumption of anti-inflammatory foods. Additionally, calculating and visualizing the inflammatory profile based on micronutrients using the Shivappa method would provide a more detailed view of micronutrient intake from an inflammatory perspective. Future research should also investigate the environmental, physiological, and political factors influencing the inflammatory profile of diets.
Acknowledgements
The authors acknowledge the Statistical Center of Iran for providing access to the data used in this study.
Authors' contributions
Conceptualization: The core research idea was conceptualized and developed by Dorosty motlagh A, Methodology: The statistical analysis was developed by Shareghfarid E in collaboration with Dorosty motlagh A. The overall study design was developed collaboratively by all authors. Supervision: Takian A and Dorosty motlagh A supervised and conceived the study. Writing original draft: Shareghfarid E drafted the manuscript. Writing review and editing: Takian A and Dorosty motlagh A critically reviewed the manuscript and suggested revisions and approved the final draft. The revisions were implemented by Shareghfarid E.
Conflict of Interest
The authors declared no conflict of interest.
Funding
No funding was received to support
References
Berger E, et al. 2019. Multi-cohort study identifies social determinants of systemic inflammation over the life course. In Nature communications, pp. 1-10.
Brewster PJ, Durward CM, Hurdle JF, Stoddard GJ & Guenther PM 2019. The grocery purchase quality index-2016 performs similarly to the healthy eating index-2015 in a national survey of household food purchases. Journal of the Academy of Nutrition and Dietetics. 119 (1): 45-56.
Brodin P, et al. 2015. Variation in the human immune system is largely driven by non-heritable influences. Cell. 160 (1-2): 37-47.
Carroll JE, et al. 2016. Partial sleep deprivation activates the DNA damage response (DDR) and the senescence-associated secretory phenotype (SASP) in aged adult humans. Brain, behavior, and immunity. 51: 223-229.
DiNicolantonio JJ, Harcombe Z & O’Keefe JH 2016. Problems with the 2015 dietary guidelines for Americans: An alternative. Missouri medicine. 113 (2): 93.
Dorosty A 2003. Iranian Food Composition Software. Tehran, School of Public Health, Tehran University of Medical Sciences.
Drewnowski A & Fulgoni III V 2008. Nutrient profiling of foods: creating a nutrient-rich food index. Nutrition reviews. 66 (1): 23-39.
Effros RB 2016. The silent war of CMV in aging and HIV infection. Mechanisms of ageing and development. 158: 46-52.
Esmaillzadeh A, et al. 2007. Dietary patterns and markers of systemic inflammation among Iranian women. Journal of nutrition. 137 (4): 992-998.
Forbes LJ, et al. 2009. Chronic exposure to outdoor air pollution and markers of systemic inflammation. Epidemiology. 20 (2): 245-253.
Franceschi C, Garagnani P, Parini P, Giuliani C & Santoro A 2018. Inflammaging: a new immune–metabolic viewpoint for age-related diseases. Nature reviews endocrinology. 14 (10): 576-590.
Galland L 2010. Diet and inflammation. Nutrition in clinical practice. 25 (6): 634-640.
Gustafsson J, Cederberg C, Sonesson U & Emanuelsson A 2013. The methodology of the FAO study: Global food losses and food waste-extent, causes and prevention”-FAO, 2011. The Swedish Institute for Food and Biotechnology: Swedish
Hankinson SE, et al. 1995. Alcohol, height, and adiposity in relation to estrogen and prolactin levels in postmenopausal women. Journal of the national cancer institute. 87 (17): 1297-1302.
Hariharan R, et al. 2022. The dietary inflammatory index, obesity, type 2 diabetes, and cardiovascular risk factors and diseases. Obesity reviews. 23 (1): e13349.
Hébert JR, et al. 2014. On the use of the dietary inflammatory index in relation to low-grade inflammation and markers of glucose metabolism in the Cohort study on Diabetes and Atherosclerosis Maastricht (CODAM) and the Hoorn study. American journal of clinical nutrition. 99 (6): 1520.
Jousilahti P, Salomaa V, Rasi V, Vahtera E & Palosuo T 2003. Association of markers of systemic inflammation, C reactive protein, serum amyloid A, and fibrinogen, with socioeconomic status. Journal of epidemiology & community health. 57 (9): 730-733.
Kantor ED, Lampe JW, Kratz M & White E 2013. Lifestyle factors and inflammation: associations by body mass index. PloS one. 8 (7): e67833.
Margină D, et al. 2020. Chronic inflammation in the context of everyday life: dietary changes as mitigating factors. International journal of environmental research and public health. 17 (11): 4135.
Marx W, et al. 2021. The dietary inflammatory index and human health: An umbrella review of meta-analyses of observational studies. Advanced nutrition. 12 (5): 1681-1690.
Monteiro CA, et al. 2019. Ultra-processed foods: what they are and how to identify them. Public health nutrition. 22 (5): 936-941.
Norde MM, Fisberg RM, Marchioni DM & Rogero MM 2020. Systemic low-grade inflammation–associated lifestyle, diet, and genetic factors: a population-based cross-sectional study. Nutrition. 70: 110596.
Pahwa R, Goyal A & Jialal I 2021. Chronic inflammation.
Pankow JS, et al. 2001. Familial and genetic determinants of systemic markers of inflammation: the NHLBI family heart study. Atherosclerosis. 154 (3): 681-689.
Patel I, Tang X, Song Z & Zhou J 2025. Relationship between dietary inflammatory index and chronic diseases in older U.S. Adults: NHANES 1999-2018. BMC public health. 25 (1): 1498.
Razzoli M, et al. 2018. Social stress shortens lifespan in mice. Aging cell. 17 (4): e12778.
Ryu S, et al. 2019. Secular trends in Dietary Inflammatory Index among adults in the United States, 1999–2014. European journal of clinical nutrition. 73 (10): 1343-1351.
Shivappa N, et al. 2017. Association between dietary inflammatory index and inflammatory markers in the HELENA study. Molecular nutrition & food research. 61 (6): 1600707.
Shivappa N, Steck SE, Hurley TG, Hussey JR & Hébert JR 2014. Designing and developing a literature-derived, population-based dietary inflammatory index. Public health nutrition. 17 (8): 1689-1696.
Statistical Center of Iran 2022. Iran household, expenditure and income, https://amar.org.ir/english.
Stout MB, Justice JN, Nicklas BJ & Kirkland JL 2017. Physiological aging: links among adipose tissue dysfunction, diabetes, and frailty. Physiology. 32 (1): 9-19.
Tabung FK, et al. 2016. Development and validation of an empirical dietary inflammatory index. Journal of nutrition. 146 (8): 1560-1570.
Wiecha JL, et al. 2006. When children eat what they watch: impact of television viewing on dietary intake in youth. Archives of pediatrics & adolescent medicine. 160 (4): 436-442.
Zitvogel L, Pietrocola F & Kroemer G 2017. Nutrition, inflammation and cancer. Nature immunology. 18 (8): 843-850.
Type of article: orginal article |
Subject:
public specific
Send email to the article author
| Rights and permissions | |
 |
This work is licensed under a Creative Commons Attribution-NonCommercial 4.0 International License. |
