
Fri, Nov 13, 2026
[Archive]
Volume 11, Issue 4 (11-2026)
J Nutr Food Secur. 2026, 11(4): 581-589 |
Back to browse issues page


Download citation:
BibTeX | RIS | EndNote | Medlars | ProCite | Reference Manager | RefWorks
Send citation to:


BibTeX | RIS | EndNote | Medlars | ProCite | Reference Manager | RefWorks
Send citation to:
Srinivasanarayanan A, Palanivelu S S. Dietary Behavior, Diet Quality and Lifestyle Patterns among Selected Coastal Fishing Communities in Ramanathapuram District, Tamil Nadu: A Cross-Sectional Study. J Nutr Food Secur. 2026; 11 (4) :581-589
URL: http://jnfs.ssu.ac.ir/article-1-1437-en.html
URL: http://jnfs.ssu.ac.ir/article-1-1437-en.html

Avinashilingam Institute of Home Science and Higher Education for Women, Coimbatore, Tamil Nadu 641- 043
Full-Text [PDF 814 kb]
(66 Downloads)
| Abstract (HTML) (614 Views)
1 Avinashilingam Institute of Home Science and Higher Education for Women, Coimbatore, Tamil Nadu 641- 043.
Introduction
Table 3 presents the dietary behavior of the participants. Meal skipping was reported by 76% of the participants, of whom 63% skipped meals daily. Most of the participants (70.4%) consumed seven to eight glasses of water per day and 95% consumed beverages. Tea varieties were the most frequently consumed beverages (91%) and about 34% consumed three servings of beverages per day. Refined sunflower oil (46%) and palm oil (69%) were the commonly used cooking oils. Moreover, about 80% reported using more than three liters of cooking oil per month.
Table 4 shows the pattern of dining out and snack consumption Dining outside was reported by 82% of participants, with 47% consuming foods away from home daily. Snacks were the most frequently consumed foods outside the home (73%). Fried snacks such as bajji or bonda and vada were consumed by 70 and 48% of the participants, respectively.
Table 5 presents the diet quality indicators derived from the DQQ. Consumption of grains, roots and tubers, and pulses were universal among participants. Dairy products and other vegetables were consumed by 97 and 85% of the participants respectively, whereas fruits, nuts and seeds, vitamin A rich fruits, and vegetables were consumed less frequently. The mean Dietary Diversity Score was 4.72±1.32, and 78% of the participants had inadequate dietary diversity.
Deep fried foods were consumed by 70.7% of the participants, while soft drinks and baked sweets were consumed by 13 and 9 % respectively. The mean NCD-Risk score was 1.64±0.96 (Table 6).
The mean NCD-protect score, NCD-risk score and Global Dietary Recommendation score were 2.48±1.11, 1.64±0.96 and 9.84±1.28, respectively (Table 7)
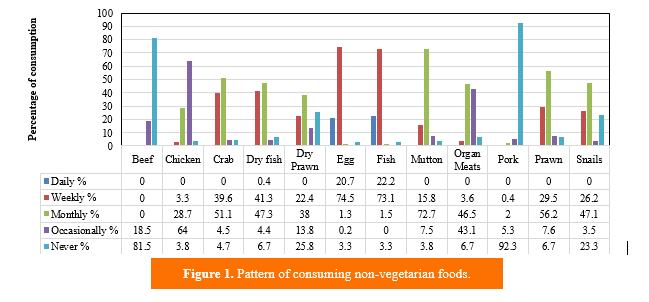
Figure 1 illustrates the frequency of seafood consumption among the participants. Beside fish, dry fish was consumed daily by a small proportion of the participants.
Discussion
WHO emphasizes that diet, lifestyle choices, and substance use significantly impact NCDs risks. This study seeks to delve into the dietary behaviors, diet quality, and lifestyle patterns specific to coastal fishing communities residing in Ramanathapuram District. The study revealed that substantial proportion of the participants belonged to the middle-aged group and lived in nuclear families with low to moderate monthly incomes. Although nearly half of the participants had normal BMI, a significant proportion (36%) were overweight or obese. In addition, a high proportion of the participants were categorized as having high-risk waist-to-hip ratio, indicating increased cardiometabolic risk. Self-reported diabetes mellitus and hypertension were reported by approximately one-third of the participants. These findings were notably higher than the combined prevalence rates reported by (Doddamani et al., 2021) (20% for hypertension and 10% for diabetes).
The findings of the present study also demonstrated unfavorable lifestyle practices among the participants. Most participants reported limited sleep duration of three to five hours, although the majority perceived their sleep quality to be satisfactory. Furthermore, smoking and alcohol consumption were more prevalent among nearly one-third of the participants. Similar findings were reported by (Basavakumar et al., 2011), who observed a high prevalence of smoking, alcohol, and betel nut chewing consumption among both adult fishermen and fisherwomen. These unhealthy lifestyle practices represent important modifiable risk factors and highlight the pressing need for health promotion programs aimed at improving behavioral practices among fishing communities.
Fish constituted the major animal-source food and was consumed daily or weekly by most participants reflecting the community’s occupational reliance on fishing. Egg consumption was relatively common, whereas the intake of mutton, chicken, and organ meats was less frequent. Similar observations have been reported by (Patro et al., 2020), who identified fish as the principal source of dietary protein among fishing communities. Likewise, Gibson et al. reported that fresh fish was the most frequently consumed animal source food among fisher households in Indonesia (Gibson et al., 2020).
Tea was the most commonly consumed beverage among the participants and dining outside was frequently reported. The habitual consumption of fried snacks and sugar sweetened beverages reflects the transition towards unhealthy dietary practices among fishing communities. The fried snacks such as bajji or bonda and vada were consumed daily, followed by weekly consumption of confectionaries such as biscuits, bread, or bun and occasional consumption of sweets. Similar findings were reported by (Annadurai et al., 2018), who observed frequent consumption of beverages such as tea, coffee, and locally prepared fried foods among the fishing community of Kancheepuram District, Tamil Nadu, India. These dietary practices warrant targeted dietary intervention among fishing communities.
Meal skipping was also highly prevalent compromising dietary adequacy. The overall dietary pattern was predominantly cereal-based. Although pulse consumption was common, the intake of whole grains, fruits, and nutrient-dense vegetables remained limited. Similar dietary patterns have been reported among Amazonian communities, where cereals constitutes the staple food and fish serves as the principal sources of protein (Medeiros and Mainbourg, 2023). Such monotonous dietary patterns may adversely affect nutrient adequacy and dietary diversity.
Diet quality assessment based on the Diet Quality Questionnaire revealed universal consumption of grains and pulses among the selected fishing community. Whereas the intake of micronutrient dense food groups, including fruits, nuts and seeds, was relatively low. The mean dietary diversity score was 4.72±1.32 with the majority of participants exhibiting inadequate dietary diversity. Furthermore, frequent consumption of deep-fried foods resulted in NCD-Risk mean score of 1.64±0.96, whereas the low NCD-Protect score of 2.48±1.11 indicates suboptimal adherence to healthy dietary recommendations. Similar findings have been reported among fishing communities as they heavily rely on cereals as staple foods, with limited intake of whole grains, fruits and vegetables likely due to economic constraints and limited nutritional awareness. Fruit intake was notably low (2-5% daily), restricted mainly to locally available varieties, which indicates limited dietary diversity probably influenced by economic constraints and food access. These patterns are consistent with findings by (Sandaruwan et al., 2016), who noted fishermen’s preference for apples, grapes, watermelon, oranges, papayas and bananas to address dehydration with perishable fruits consumed within four days. Studies show that nutritional awareness is positively associated with diet quality, dietary diversity, and adherence to dietary recommendations. The fishing communities often face low and unstable income contributing to poverty and nutritional deficiencies. Targeted interventions focusing on nutrition education, health promotion, and addressing educational gaps are necessary (Rahaman et al., 2021).
The strengths of the present study include its community-based design and relatively large sample size. The use of the standardized Diet Quality Questionnaire enabled a comprehensive assessment of dietary behavior and diet quality among a population with limited available evidence. The study has certain limitations. Information obtained through interviews and self-reported medical history may be subject to recall bias. In addition, the cross-sectional design limits causal interpretations of the study. Dietary intake assessed using the previous-day recall approach of the Diet Quality Questionnaire may not fully represent habitual dietary intake. Future research employing longitudinal designs and intervention approaches are warranted to improve dietary diversity and promote healthy lifestyle practices among coastal fishing communities.
Full-Text: (26 Views)
Dietary Behavior, Diet Quality and Lifestyle Patterns among Selected Coastal Fishing Communities in Ramanathapuram District, Tamil Nadu:
A Cross-Sectional Study
Adithiyalakshmi Srinivasanarayanan; MSc1* & Sridevi Sivakami Palanivelu; PhD1
A Cross-Sectional Study
Adithiyalakshmi Srinivasanarayanan; MSc1* & Sridevi Sivakami Palanivelu; PhD1
1 Avinashilingam Institute of Home Science and Higher Education for Women, Coimbatore, Tamil Nadu 641- 043.
| ARTICLE INFO | ABSTRACT | |
| ORIGINAL ARTICLE | Background: Diet quality and lifestyle practices are important determinants of nutritional status and health. The present study assessed the dietary behavior, diet quality and lifestyle patterns among selected coastal fishing communities in Ramanathapuram district, Tamil Nadu, India. Methods: A community-based cross-sectional study was conducted among 550 participants using simple random sampling. Data were collected using a self-developed validated interview schedule, Food Frequency Questionnaire (FFQ), and the standardized Diet Quality Questionnaire developed by the Global Diet Quality Project. Results: Most participants belonged to the age groups of 36 to 55 years. Nearly half of the participants had normal body mass index (BMI), while over one-third were overweight and the majority were categorized as having high-risk waist-to-hip ratio. Self-reported diabetes mellitus and hypertension were reported by approximately one-third of the participants. Meal skipping was prevalent and following cereal and seafood-based diet was predominant among the participants. Moreover, tea was the most frequently consumed beverage. Diet quality assessment also revealed inadequate consumption of fruits, nuts and seeds and vitamin A rich oods. The mean Dietary Diversity Score and Global Dietary Recommendation Score were 4.72±1.32 and 9.84±1.28 respectively, indicating poor dietary diversity and suboptimal diet quality. Conclusion: The study demonstrated inadequate dietary diversity and unhealthy lifestyle practices among the coastal fishing community. These findings emphasize the need for context-specific nutrition education and health promotion strategies to improve dietary quality and promote healthy lifestyle practices. | |
| Article history: Received: 19 Aug 2025 Revised: 28 Jun 2026 Accepted: 28 Jun 2026 |
||
| *Corresponding author: adithiyaphdresources@gmail.com Department of Food Service Management and Dietetics, Avinashilingam Institute for Home Science and Higher Education for Women, Coimbatore, Tamil Nadu, India Postal code: 641043 Tel: +91 9384384840 |
||
Keywords: Dietary behavior; Diet quality; Fishermen; Food habits; Lifestyle. |
Introduction
The fisheries sector provides livelihood to nearly 60 million people worldwide, with the majority of fishers residing in Asia. Globally, India ranks second in marine fisheries production, with approximately 14 million people actively engaged in fisheries, accounting for 8 % of the total global fisheries output (Ministry of Fisheries Animal Husbandry and Dairying, 2025). The eastern coastal region contributes substantially to India’s marine fish production, with Tamil Nadu accounting for nearly 14 % of the national production (Ahmed and Ahmed, 2022). In addition, diet quality plays a vital role in maintaining health, whereas poor dietary behavior and unhealthy lifestyle practices increase the risk of obesity, diabetes mellitus, cardiovascular diseases and cancers (Grosso et al., 2020). Socioeconomic conditions, educational status and occupation strongly influence dietary choices and limited awareness or affordability of healthy foods may contribute to the double burden of malnutrition (Miller et al., 2020). There is a well-established relationship between socioeconomic conditions and dietary quality. Alarmingly, obesity, irregular eating patterns and poor quality breakfasts are highly prevalent in the most deprived areas (Bunn and Rolker, 2022).
Numerous studies have shown that Indian adults consume excessive amounts of salt, oils and meats while fruits, vegetables, legumes and eggs remain below recommended levels (Jain et al., 2023). Studies among fishing communities have reported that dietary diversity and food security are closely associated with household income (Roberts et al., 2022), while unhealthy lifestyle practices and macro- and micronutrient deficiencies are common among fisherfolk populations (Rahaman et al., 2021). Although research on nutrition and health transitions has progressed significantly in India, limited evidence is available regarding dietary behavior, diet quality and lifestyle practices among coastal fishing communities in Tamil Nadu. Understanding these aspects is essential for identifying nutritional concerns and promoting healthy lifestyle practices among vulnerable fishing populations (Ramachandran and Kalaivani, 2023). Therefore, the present cross-sectional study was undertaken to assess dietary behavior, diet quality and lifestyle patterns among selected coastal fishing communities in Ramanathapuram district, Tamil Nadu, India.
Materials and Methods
Study design
A community-based cross-sectional study was conducted among coastal fishing communities of Ramanathapuram District, Tamil Nadu, India, using a structured interview schedule to collect the required information.
Study settings and sampling
This study involved the coastal fishing communities of Ramanathapuram district, known for its extensive coastline and substantial population engaged in marine fishing and allied activities. Using simple random sampling technique, the sample size was calculated through the formula provided by Yamane (Yamane, 1967), n=N/1+N*(e2), resulting in a minimum of 400 participants.
The study involved about 550 fisherfolk from the coastal villages of Ramanathapuram district. Individuals aged between 20 and 60 years who were actively engaged in fishing and allied occupations, those who played key role in household economy and provided written informed consent were included in the study. Those who were unwilling to participate, did not provide informed consent, had severe or acute medical conditions or were not involved in fishing and allied activities during the study period were excluded.
Study instrument
A well-structured, self-developed interview schedule was used to collect information on demographic characteristics, anthropometric measurements, dietary behavior, and lifestyle patterns. The content validity of the interview schedule was established using the Content Validity Index (CVI) method (Yusoff, 2019). The scale-level Content Validity Index (S-CVI) was 0.96, suggesting a high-degree of agreement among experts. Reliability of the interview schedule was assessed using Cronbach’s alpha coefficient. During the study, participants were interviewed to gather basic information such as age, family type, family size, occupational structure and monthly income.
Anthropometric assessment including height, weight, waist and hip circumference was recorded with calibrated instruments. Height was measured using a portable stadiometer to the nearest 0.1 cm and body weight was recorded using a calibrated digital weighing scale to the nearest 0.1kg. Waist and hip circumference were also measured using a non-stretchable measuring tape. Body mass index (BMI) and waist-to-hip ratio were calculated and classified according to World Health Organization (WHO) guidelines (World Health Organization, 2008). Information regarding self-reported history of non-communicable diseases (NCDs), including diabetes mellitus, hypertension and heart disease was then collected during the survey.
Assessment of dietary behavior, diet quality and lifestyle patterns
The interview schedule included separate sections to assess dietary behavior and lifestyle patterns among the fishing communities. Dietary behavior was assessed by obtaining information on food habits, frequency of meal skipping, water and beverage consumption per day, type of cooking oil used, amount of cooking oil used per month, and frequency of dining out. Lifestyle-related variables included sleep hygiene, substance use, and duration of fishing activities.
In addition, a Food Frequency Questionnaire (FFQ) was used to assess the frequency of consumption of major food groups, including cereals, pulses and legumes, roots and tubers, vegetables, fruits, milk and milk products, flesh foods, sugars, fats and oils, nuts and beverages. The frequency of consumption was recorded as daily, weekly, monthly, occasionally, or never.
Diet quality was assessed using the standardized Diet Quality Questionnaire (DQQ) developed by the Global Diet Quality Project. The DQQ is a low-burden dietary assessment tool based on foods consumed during the previous day and uses yes or no questions to record the consumption of specific food items across 29 food groups (Adeyemi et al., 2025). The questionnaire enables the estimation of key diet quality indicators, including Dietary Diversity Score (DDS), Non-Communicable Disease Protect Score (NCD-Protect), Non-Communicable Disease Risk Score (NCD-Risk) and Global Dietary Recommendation Score (GDR-Score), thereby facilitating the assessment of dietary diversity, nutrient adequacy, and dietary risk factors associated with NCDs.
Ethical considerations
The Institutional Human Ethical Committee (IHEC) at Avinashilingam Institute in Coimbatore approved the study (AUW/XMT-038 and FSMD/IHEC/23-24). The approval process ensured that the research adhered to ethical standards. Additionally, written informed consent was obtained from all participants after explaining the purpose and procedures of the study in the local language.
Data analysis
The collected data were cleaned, coded, entered into Microsoft Excel, and subsequently, analyzed using the Statistical Package for the Social Sciences (SPSS) version 27. Descriptive statistics, including frequency, percentage, mean and standard deviation were used to summarize the demographic characteristics, dietary behavior, diet quality and lifestyle patterns of the participants.
Results
The dietary behavior and lifestyle pattern of the selected participants (n=550) were assessed. As shown in Table 1, about 30% of the participants belonged to the age groups of 36-45 years and 46-55 years, respectively. Most of the selected participants belonged to nuclear families (89%) and nearly two-fifths (40%) had four family members. About 37% had a monthly income ranging from 7,681 to 10,240 Rupees.
Based on WHO criteria, about 45% of the participants had normal BMI, while 35% were overweight and 13% were obese. According to waist-to-hip ratio, 92% of the participants were categorized as having high risk waist-to-hip ratio. Self-reported diabetes mellitus and hypertension were also reported by about 31% of the participants respectively.
Table 2 shows the lifestyle characteristics of the selected participants. Most of the participants (72%) spent three to six hours in fishing activities and about 79% reported sleeping for three to five hours per day. Good quality of sleep was reported by 67% of the participants, whereas 24% experienced disrupted sleep. Smoking and alcohol consumption were also reported by 32 and 31% of the participants, respectively.
Numerous studies have shown that Indian adults consume excessive amounts of salt, oils and meats while fruits, vegetables, legumes and eggs remain below recommended levels (Jain et al., 2023). Studies among fishing communities have reported that dietary diversity and food security are closely associated with household income (Roberts et al., 2022), while unhealthy lifestyle practices and macro- and micronutrient deficiencies are common among fisherfolk populations (Rahaman et al., 2021). Although research on nutrition and health transitions has progressed significantly in India, limited evidence is available regarding dietary behavior, diet quality and lifestyle practices among coastal fishing communities in Tamil Nadu. Understanding these aspects is essential for identifying nutritional concerns and promoting healthy lifestyle practices among vulnerable fishing populations (Ramachandran and Kalaivani, 2023). Therefore, the present cross-sectional study was undertaken to assess dietary behavior, diet quality and lifestyle patterns among selected coastal fishing communities in Ramanathapuram district, Tamil Nadu, India.
Materials and Methods
Study design
A community-based cross-sectional study was conducted among coastal fishing communities of Ramanathapuram District, Tamil Nadu, India, using a structured interview schedule to collect the required information.
Study settings and sampling
This study involved the coastal fishing communities of Ramanathapuram district, known for its extensive coastline and substantial population engaged in marine fishing and allied activities. Using simple random sampling technique, the sample size was calculated through the formula provided by Yamane (Yamane, 1967), n=N/1+N*(e2), resulting in a minimum of 400 participants.
The study involved about 550 fisherfolk from the coastal villages of Ramanathapuram district. Individuals aged between 20 and 60 years who were actively engaged in fishing and allied occupations, those who played key role in household economy and provided written informed consent were included in the study. Those who were unwilling to participate, did not provide informed consent, had severe or acute medical conditions or were not involved in fishing and allied activities during the study period were excluded.
Study instrument
A well-structured, self-developed interview schedule was used to collect information on demographic characteristics, anthropometric measurements, dietary behavior, and lifestyle patterns. The content validity of the interview schedule was established using the Content Validity Index (CVI) method (Yusoff, 2019). The scale-level Content Validity Index (S-CVI) was 0.96, suggesting a high-degree of agreement among experts. Reliability of the interview schedule was assessed using Cronbach’s alpha coefficient. During the study, participants were interviewed to gather basic information such as age, family type, family size, occupational structure and monthly income.
Anthropometric assessment including height, weight, waist and hip circumference was recorded with calibrated instruments. Height was measured using a portable stadiometer to the nearest 0.1 cm and body weight was recorded using a calibrated digital weighing scale to the nearest 0.1kg. Waist and hip circumference were also measured using a non-stretchable measuring tape. Body mass index (BMI) and waist-to-hip ratio were calculated and classified according to World Health Organization (WHO) guidelines (World Health Organization, 2008). Information regarding self-reported history of non-communicable diseases (NCDs), including diabetes mellitus, hypertension and heart disease was then collected during the survey.
Assessment of dietary behavior, diet quality and lifestyle patterns
The interview schedule included separate sections to assess dietary behavior and lifestyle patterns among the fishing communities. Dietary behavior was assessed by obtaining information on food habits, frequency of meal skipping, water and beverage consumption per day, type of cooking oil used, amount of cooking oil used per month, and frequency of dining out. Lifestyle-related variables included sleep hygiene, substance use, and duration of fishing activities.
In addition, a Food Frequency Questionnaire (FFQ) was used to assess the frequency of consumption of major food groups, including cereals, pulses and legumes, roots and tubers, vegetables, fruits, milk and milk products, flesh foods, sugars, fats and oils, nuts and beverages. The frequency of consumption was recorded as daily, weekly, monthly, occasionally, or never.
Diet quality was assessed using the standardized Diet Quality Questionnaire (DQQ) developed by the Global Diet Quality Project. The DQQ is a low-burden dietary assessment tool based on foods consumed during the previous day and uses yes or no questions to record the consumption of specific food items across 29 food groups (Adeyemi et al., 2025). The questionnaire enables the estimation of key diet quality indicators, including Dietary Diversity Score (DDS), Non-Communicable Disease Protect Score (NCD-Protect), Non-Communicable Disease Risk Score (NCD-Risk) and Global Dietary Recommendation Score (GDR-Score), thereby facilitating the assessment of dietary diversity, nutrient adequacy, and dietary risk factors associated with NCDs.
Ethical considerations
The Institutional Human Ethical Committee (IHEC) at Avinashilingam Institute in Coimbatore approved the study (AUW/XMT-038 and FSMD/IHEC/23-24). The approval process ensured that the research adhered to ethical standards. Additionally, written informed consent was obtained from all participants after explaining the purpose and procedures of the study in the local language.
Data analysis
The collected data were cleaned, coded, entered into Microsoft Excel, and subsequently, analyzed using the Statistical Package for the Social Sciences (SPSS) version 27. Descriptive statistics, including frequency, percentage, mean and standard deviation were used to summarize the demographic characteristics, dietary behavior, diet quality and lifestyle patterns of the participants.
Results
The dietary behavior and lifestyle pattern of the selected participants (n=550) were assessed. As shown in Table 1, about 30% of the participants belonged to the age groups of 36-45 years and 46-55 years, respectively. Most of the selected participants belonged to nuclear families (89%) and nearly two-fifths (40%) had four family members. About 37% had a monthly income ranging from 7,681 to 10,240 Rupees.
Based on WHO criteria, about 45% of the participants had normal BMI, while 35% were overweight and 13% were obese. According to waist-to-hip ratio, 92% of the participants were categorized as having high risk waist-to-hip ratio. Self-reported diabetes mellitus and hypertension were also reported by about 31% of the participants respectively.
Table 2 shows the lifestyle characteristics of the selected participants. Most of the participants (72%) spent three to six hours in fishing activities and about 79% reported sleeping for three to five hours per day. Good quality of sleep was reported by 67% of the participants, whereas 24% experienced disrupted sleep. Smoking and alcohol consumption were also reported by 32 and 31% of the participants, respectively.
| Table 1. Demographic profile of the selected participants. | ||
| Variables | n | % |
| Age (years) < 24 25-35 36-45 4655 >56 |
19 75 167 166 123 |
4 14 30 30 22 |
| Type of family Nuclear Joint |
491 59 |
89.3 10.8 |
| Number of family members 2 3 4 ≥5 |
110 122 217 101 |
20 22.2 39.5 18.4 |
| Monthly income (Rupees) <1000 1001 to 3000 3001 to 5000 5001 to 7680 7681 to 10240 10241 to 20481 >20482 |
10 36 82 163 204 51 4 |
1.9 6.5 14.9 29.6 37.1 9.3 0.7 |
| BMI(kg/m2) Underweight Normal Overweight Grade 1 obese Grade 2 obese Extremely obese |
31 249 196 65 8 1 |
5.6 45.3 35.6 11.8 1.5 0.2 |
| WHR No risk High risk |
45 505 |
8.2 91.8 |
| Self-reported medical history Diabetes mellitus Hypertension Heart disease |
171 174 9 |
31.1 31.6 1.6 |
| BMI: Body mass index; WHR: Waist-to-hip ratio (low risk (<0.95 for men and <0.80 for women). | ||
Table 3 presents the dietary behavior of the participants. Meal skipping was reported by 76% of the participants, of whom 63% skipped meals daily. Most of the participants (70.4%) consumed seven to eight glasses of water per day and 95% consumed beverages. Tea varieties were the most frequently consumed beverages (91%) and about 34% consumed three servings of beverages per day. Refined sunflower oil (46%) and palm oil (69%) were the commonly used cooking oils. Moreover, about 80% reported using more than three liters of cooking oil per month.
Table 4 shows the pattern of dining out and snack consumption Dining outside was reported by 82% of participants, with 47% consuming foods away from home daily. Snacks were the most frequently consumed foods outside the home (73%). Fried snacks such as bajji or bonda and vada were consumed by 70 and 48% of the participants, respectively.
| Table 2. Lifestyle pattern of the selected participants. | ||
| Lifestyle pattern | n | % |
| Spent time on fishing Three to six hours Seven to ten hours One day More than a day |
394 102 44 10 |
71.6 18.5 8.0 1.8 |
| Spent time on sleep Below 3 hours Three to five hours Six hours or more |
22 435 93 |
4 79.1 16.9 |
| Quality of sleep Good Disrupted Having difficulty |
370 130 50 |
67.3 23.6 9.1 |
| Habit of substance use Smoking (beedi/cigarette) Alcohol |
178 169 |
32.3 30.7 |
Table 5 presents the diet quality indicators derived from the DQQ. Consumption of grains, roots and tubers, and pulses were universal among participants. Dairy products and other vegetables were consumed by 97 and 85% of the participants respectively, whereas fruits, nuts and seeds, vitamin A rich fruits, and vegetables were consumed less frequently. The mean Dietary Diversity Score was 4.72±1.32, and 78% of the participants had inadequate dietary diversity.
Deep fried foods were consumed by 70.7% of the participants, while soft drinks and baked sweets were consumed by 13 and 9 % respectively. The mean NCD-Risk score was 1.64±0.96 (Table 6).
The mean NCD-protect score, NCD-risk score and Global Dietary Recommendation score were 2.48±1.11, 1.64±0.96 and 9.84±1.28, respectively (Table 7)
| Table 3. Dietary behaviour of the selected participants. | ||
| Dietary behaviour | n | % |
| Skipping of meals Yes No |
417 133 |
75.8 24.2 |
| Frequency of skipping meals Daily Occasionally |
347 68 |
63.1 12.3 |
| Water drink per day (glass) <5 5-6 7-8 >8 |
9 146 387 8 |
1.6 26.5 70.4 1.5 |
| Habit of consuming beverages Yes No |
521 29 |
94.7 5.3 |
| Type of beverage Plain milk Coffee varieties Tea varieties |
17 70 501 |
3.1 12.7 91.1 |
| Number of servings of beverages per day 1 2 3 >4 |
82 155 188 96 |
14.9 28.2 34.2 17.5 |
| Type of cooking oil Coconut oil Groundnut oil Sesame oil Palm oil Refined sunflower oil |
22 4 3 380 251 |
4.0 0.7 0.6 69.1 45.6 |
| Amount of cooking oil used per month (litre) <3 >3 |
111 439 |
20.2 79.8 |
Figure 1 illustrates the frequency of seafood consumption among the participants. Beside fish, dry fish was consumed daily by a small proportion of the participants.
Discussion
WHO emphasizes that diet, lifestyle choices, and substance use significantly impact NCDs risks. This study seeks to delve into the dietary behaviors, diet quality, and lifestyle patterns specific to coastal fishing communities residing in Ramanathapuram District. The study revealed that substantial proportion of the participants belonged to the middle-aged group and lived in nuclear families with low to moderate monthly incomes. Although nearly half of the participants had normal BMI, a significant proportion (36%) were overweight or obese. In addition, a high proportion of the participants were categorized as having high-risk waist-to-hip ratio, indicating increased cardiometabolic risk. Self-reported diabetes mellitus and hypertension were reported by approximately one-third of the participants. These findings were notably higher than the combined prevalence rates reported by (Doddamani et al., 2021) (20% for hypertension and 10% for diabetes).
The findings of the present study also demonstrated unfavorable lifestyle practices among the participants. Most participants reported limited sleep duration of three to five hours, although the majority perceived their sleep quality to be satisfactory. Furthermore, smoking and alcohol consumption were more prevalent among nearly one-third of the participants. Similar findings were reported by (Basavakumar et al., 2011), who observed a high prevalence of smoking, alcohol, and betel nut chewing consumption among both adult fishermen and fisherwomen. These unhealthy lifestyle practices represent important modifiable risk factors and highlight the pressing need for health promotion programs aimed at improving behavioral practices among fishing communities.
Fish constituted the major animal-source food and was consumed daily or weekly by most participants reflecting the community’s occupational reliance on fishing. Egg consumption was relatively common, whereas the intake of mutton, chicken, and organ meats was less frequent. Similar observations have been reported by (Patro et al., 2020), who identified fish as the principal source of dietary protein among fishing communities. Likewise, Gibson et al. reported that fresh fish was the most frequently consumed animal source food among fisher households in Indonesia (Gibson et al., 2020).
Tea was the most commonly consumed beverage among the participants and dining outside was frequently reported. The habitual consumption of fried snacks and sugar sweetened beverages reflects the transition towards unhealthy dietary practices among fishing communities. The fried snacks such as bajji or bonda and vada were consumed daily, followed by weekly consumption of confectionaries such as biscuits, bread, or bun and occasional consumption of sweets. Similar findings were reported by (Annadurai et al., 2018), who observed frequent consumption of beverages such as tea, coffee, and locally prepared fried foods among the fishing community of Kancheepuram District, Tamil Nadu, India. These dietary practices warrant targeted dietary intervention among fishing communities.
| Table 4. Pattern of dining out and snack consumption. | ||||
| Dietary behavior | n | % | ||
| Habit of dining outside Yes No |
452 98 |
82.2 17.7 |
||
| Frequency of dining outside Daily Weekly Monthly Occasionally |
257 48 105 42 |
46.7 8.7 19.1 7.7 |
||
| Type of foods consumed outside Snacks Beverages Meals |
399 160 35 |
72.5 29.1 6.4 |
||
| Frequency of snacking (%) | Daily | Weekly | Occasionally | Never |
| Fried snack 1 (Bajji/Bonda) | 69.8 | 20.4 | 5.1 | 4.7 |
| Fried snack 2(Vada) | 48.4 | 35.8 | 6.5 | 9.2 |
| Biscuits | 9.3 | 63.1 | 7.1 | 20.5 |
| Bread / Bun | 4.4 | 60 | 8.4 | 27.2 |
| Sweets | 0 | 14.5 | 43.6 | 43.4 |
| Table 5. Diet quality indicators based on the diet quality questionnaire. | ||
| Diet quality components | n | % |
| Grains, white roots and tubers, and plantains | 550 | 100 |
| Pulses | 550 | 100 |
| Nuts and seeds | 13 | 2.4 |
| Dairy | 535 | 97.3 |
| Meat, poultry, fish | 122 | 22.2 |
| Eggs | 114 | 20.7 |
| Dark green leafy vegetables | 136 | 24.7 |
| Other vitamin A rich fruits and vegetables | 62 | 11.3 |
| Other vegetables | 465 | 84.5 |
| Other fruits | 42 | 7.6 |
| Nutrient inadequacy (0-5) | 429 | 78 |
| Nutrient adequacy (6-10) | 121 | 22 |
| Dietary diversity score (0-10) (Mean±SD) | 4.72±1.32 | |
Meal skipping was also highly prevalent compromising dietary adequacy. The overall dietary pattern was predominantly cereal-based. Although pulse consumption was common, the intake of whole grains, fruits, and nutrient-dense vegetables remained limited. Similar dietary patterns have been reported among Amazonian communities, where cereals constitutes the staple food and fish serves as the principal sources of protein (Medeiros and Mainbourg, 2023). Such monotonous dietary patterns may adversely affect nutrient adequacy and dietary diversity.
Diet quality assessment based on the Diet Quality Questionnaire revealed universal consumption of grains and pulses among the selected fishing community. Whereas the intake of micronutrient dense food groups, including fruits, nuts and seeds, was relatively low. The mean dietary diversity score was 4.72±1.32 with the majority of participants exhibiting inadequate dietary diversity. Furthermore, frequent consumption of deep-fried foods resulted in NCD-Risk mean score of 1.64±0.96, whereas the low NCD-Protect score of 2.48±1.11 indicates suboptimal adherence to healthy dietary recommendations. Similar findings have been reported among fishing communities as they heavily rely on cereals as staple foods, with limited intake of whole grains, fruits and vegetables likely due to economic constraints and limited nutritional awareness. Fruit intake was notably low (2-5% daily), restricted mainly to locally available varieties, which indicates limited dietary diversity probably influenced by economic constraints and food access. These patterns are consistent with findings by (Sandaruwan et al., 2016), who noted fishermen’s preference for apples, grapes, watermelon, oranges, papayas and bananas to address dehydration with perishable fruits consumed within four days. Studies show that nutritional awareness is positively associated with diet quality, dietary diversity, and adherence to dietary recommendations. The fishing communities often face low and unstable income contributing to poverty and nutritional deficiencies. Targeted interventions focusing on nutrition education, health promotion, and addressing educational gaps are necessary (Rahaman et al., 2021).
The strengths of the present study include its community-based design and relatively large sample size. The use of the standardized Diet Quality Questionnaire enabled a comprehensive assessment of dietary behavior and diet quality among a population with limited available evidence. The study has certain limitations. Information obtained through interviews and self-reported medical history may be subject to recall bias. In addition, the cross-sectional design limits causal interpretations of the study. Dietary intake assessed using the previous-day recall approach of the Diet Quality Questionnaire may not fully represent habitual dietary intake. Future research employing longitudinal designs and intervention approaches are warranted to improve dietary diversity and promote healthy lifestyle practices among coastal fishing communities.
| Table 6. Unhealthy food consumption as an indicator of dietary factors for ncds among the selected participants. | ||
| Unhealthy food consumption | n | % |
| Soft drinks | 70 | 12.7 |
| Baked/grain-based sweets | 51 | 9.3 |
| Other sweets | 12 | 2.18 |
| Deep fried food | 389 | 70.7 |
| Packaged ultra processed foods | 3 | 0.54 |
| NCD-Risk score(0-9) (Mean±SD) | 1.64±0.96 | |
| Table 7. Global dietary recommendation score of selected participants. | |
| Global dietary recommendation score | Mean±SD |
| NCD protect score (0-9) | 2.48±1.11 |
| NCD risk score (0-9) | 1.64±0.96 |
| Global dietary recommendation score (NCD-Protect - NCD-Risk + 9 = GDR score) |
9.84±1.28 |
| NCD: Non communicable disease | |
Conclusions
The present study revealed that the diet quality, dietary behavior, and lifestyle patterns of coastal fishing community in Ramanathapuram District, Tamil Nadu, India, were characterized by a cereal and seafood-based dietary pattern with inadequate consumption of micronutrient-rich food such as fruits, dark green leafy vegetables and nuts. Frequent consumption of deep-fried snack and sugar-sweetened beverages together with unhealthy lifestyle practices including smoking, alcohol use, and short sleep duration were commonly observed. These findings emphasize the need for context-specific nutrition education and health promotion strategies to improve dietary diversity and encourage healthy lifestyle practices among coastal fishing communities.
Acknowledgement
The authors would like to thank the Indian Council of Social Science Research (ICSSR) Centrally Administered Full-Term Doctoral Fellowship (2024-2025) and T.S. Avinashilingam Fellowship (2023- 2024) for their support.
The present study revealed that the diet quality, dietary behavior, and lifestyle patterns of coastal fishing community in Ramanathapuram District, Tamil Nadu, India, were characterized by a cereal and seafood-based dietary pattern with inadequate consumption of micronutrient-rich food such as fruits, dark green leafy vegetables and nuts. Frequent consumption of deep-fried snack and sugar-sweetened beverages together with unhealthy lifestyle practices including smoking, alcohol use, and short sleep duration were commonly observed. These findings emphasize the need for context-specific nutrition education and health promotion strategies to improve dietary diversity and encourage healthy lifestyle practices among coastal fishing communities.
Acknowledgement
The authors would like to thank the Indian Council of Social Science Research (ICSSR) Centrally Administered Full-Term Doctoral Fellowship (2024-2025) and T.S. Avinashilingam Fellowship (2023- 2024) for their support.
Authors' contributions
Srinivasanarayanan A contributed to the conceptualization of the study, methodology design, data collection, statistical analysis, data interpretation, and drafting of the manuscript. Palanivelu SS supervised the research work, provided guidance in study design and methodology, and critically reviewed and edited the manuscript.
Conflict of Interest
The authors declared no conflict of interest.
Funding
The present study was funded by the Indian Council for Social Science Research - Centrally Administered Full-term Doctoral Fellowship (2024–2025) and the Dr. T.S Avinashilingam Fellowship (2023–2024), Avinashilingam Institute for Home Science and Higher Education for Women, Coimbatore, Tamil Nadu, India.
References
Adeyemi O, Momoh M, Makka J & Oladipo R 2025. The diet quality questionnaire (DQQ) is a straightforward data collection tool for assessing minimum dietary diversity for women (MDD-W). Current developments in nutrition. 9 (6): 107451.
Ahmed H & Ahmed I 2022. Current status of fisheries resource of India: Present status and future prospective. Bangladesh journal of fisheries. 34: 119-130.
Annadurai K, Balan N & Ranaganathan K 2018. Non-communicable disease risk factor profile among Fishermen community of Kancheepuram district, Tamil Nadu: a cross sectional study. International journal of community medicine and public health. 5 (2): 708-713.
Basavakumar K, Devendrappa S DS & Srenivas S 2011. A study on profile of fishing community of a village in Karnataka. Karnataka journal of agricultural sciences. 24 (5).
Bunn S & Rolker H 2022. Diet-related health inequalities in UK. In POSTNOTE: UK PARLIAMENT.
Doddamani A, Ballala A, Madhyastha S, Kamath A & Kulkarni M 2021. A cross-sectional study to identify the determinants of non-communicable diseases among fishermen in Southern India. BMC public health. 21 (1): 414.
Gibson E, Stacey N, Sunderland TCH & Adhuri DS 2020. Dietary diversity and fish consumption of mothers and their children in fisher households in Komodo District, eastern Indonesia. PLOS one. 15 (4): e0230777.
Grosso G, Mateo Urdiales A, Rangelov N, Buzeti T & Birt C 2020. Nutrition in the context of the Sustainable Development Goals. European journal of public health. 30: i19-i23.
Jain A, Sharma S, Kim R & Subramanian S 2023. Food deprivation among adults in India: an analysis of specific food categories, 2016-2021. eClinicalMedicine. 66: 102313.
Medeiros A & Mainbourg E 2023. Food consumption profile of rural riverside populations. Rural remote health. 23 (4): 7730.
Miller V, Webb P, Micha R & Mozaffarian D 2020. Defining diet quality: a synthesis of dietary quality metrics and their validity for the double burden of malnutrition. Lancet planet health. 4 (8): e352-e370.
Ministry of Fisheries Animal Husbandry and Dairying 2025. Department of Fisheries, Ministry of Fisheries, Animal Husbandry and Dairying, Government of India. Casting nets, catching success: India’s fisheries on the rise. New Delhi.
Patro S, Sahu B & Pati BK 2020. Food consumption pattern and nutrient intake by the Fishermen community of Ganjam District, Odisha. International journal of current microbiology and applied sciences. 9 (12): 672-680.
Rahaman S, et al. 2021. Socio-demographic profile, nutritional and health status of fishermen: A Review. Bangladesh journal of medical science. 20 (4): 707-713.
Ramachandran P & Kalaivani K 2023. Research in nutrition & health interactions: achievements & challenges. Indian journal of medical research. 158 (2): 97-100.
Roberts N, et al. 2022. Fish consumption pathways and food security in an Indonesian fishing community. Food security. 15 (1): 1-19.
Sandaruwan K, De Silva D & Amarala K 2016. A study of food consumption pattern, food culture and nutritional status of the multi-day Fishermen of Sri LankaIn in Third International Research Symposium, Rajarata University of Sri Lanka
World Health Organization 2008. Waist circumference and waist–hip ratio: report of a WHO expert consultation, Geneva.
Yamane T 1967. Statistics: An introductory analysis. American journal of applied mathematics and statistics. 4 (6): 178-184.
Yusoff MSB 2019. ABC of content validation and content validity index calculation. Education in medicine journal. 11: 49-54.
Srinivasanarayanan A contributed to the conceptualization of the study, methodology design, data collection, statistical analysis, data interpretation, and drafting of the manuscript. Palanivelu SS supervised the research work, provided guidance in study design and methodology, and critically reviewed and edited the manuscript.
Conflict of Interest
The authors declared no conflict of interest.
Funding
The present study was funded by the Indian Council for Social Science Research - Centrally Administered Full-term Doctoral Fellowship (2024–2025) and the Dr. T.S Avinashilingam Fellowship (2023–2024), Avinashilingam Institute for Home Science and Higher Education for Women, Coimbatore, Tamil Nadu, India.
References
Adeyemi O, Momoh M, Makka J & Oladipo R 2025. The diet quality questionnaire (DQQ) is a straightforward data collection tool for assessing minimum dietary diversity for women (MDD-W). Current developments in nutrition. 9 (6): 107451.
Ahmed H & Ahmed I 2022. Current status of fisheries resource of India: Present status and future prospective. Bangladesh journal of fisheries. 34: 119-130.
Annadurai K, Balan N & Ranaganathan K 2018. Non-communicable disease risk factor profile among Fishermen community of Kancheepuram district, Tamil Nadu: a cross sectional study. International journal of community medicine and public health. 5 (2): 708-713.
Basavakumar K, Devendrappa S DS & Srenivas S 2011. A study on profile of fishing community of a village in Karnataka. Karnataka journal of agricultural sciences. 24 (5).
Bunn S & Rolker H 2022. Diet-related health inequalities in UK. In POSTNOTE: UK PARLIAMENT.
Doddamani A, Ballala A, Madhyastha S, Kamath A & Kulkarni M 2021. A cross-sectional study to identify the determinants of non-communicable diseases among fishermen in Southern India. BMC public health. 21 (1): 414.
Gibson E, Stacey N, Sunderland TCH & Adhuri DS 2020. Dietary diversity and fish consumption of mothers and their children in fisher households in Komodo District, eastern Indonesia. PLOS one. 15 (4): e0230777.
Grosso G, Mateo Urdiales A, Rangelov N, Buzeti T & Birt C 2020. Nutrition in the context of the Sustainable Development Goals. European journal of public health. 30: i19-i23.
Jain A, Sharma S, Kim R & Subramanian S 2023. Food deprivation among adults in India: an analysis of specific food categories, 2016-2021. eClinicalMedicine. 66: 102313.
Medeiros A & Mainbourg E 2023. Food consumption profile of rural riverside populations. Rural remote health. 23 (4): 7730.
Miller V, Webb P, Micha R & Mozaffarian D 2020. Defining diet quality: a synthesis of dietary quality metrics and their validity for the double burden of malnutrition. Lancet planet health. 4 (8): e352-e370.
Ministry of Fisheries Animal Husbandry and Dairying 2025. Department of Fisheries, Ministry of Fisheries, Animal Husbandry and Dairying, Government of India. Casting nets, catching success: India’s fisheries on the rise. New Delhi.
Patro S, Sahu B & Pati BK 2020. Food consumption pattern and nutrient intake by the Fishermen community of Ganjam District, Odisha. International journal of current microbiology and applied sciences. 9 (12): 672-680.
Rahaman S, et al. 2021. Socio-demographic profile, nutritional and health status of fishermen: A Review. Bangladesh journal of medical science. 20 (4): 707-713.
Ramachandran P & Kalaivani K 2023. Research in nutrition & health interactions: achievements & challenges. Indian journal of medical research. 158 (2): 97-100.
Roberts N, et al. 2022. Fish consumption pathways and food security in an Indonesian fishing community. Food security. 15 (1): 1-19.
Sandaruwan K, De Silva D & Amarala K 2016. A study of food consumption pattern, food culture and nutritional status of the multi-day Fishermen of Sri LankaIn in Third International Research Symposium, Rajarata University of Sri Lanka
World Health Organization 2008. Waist circumference and waist–hip ratio: report of a WHO expert consultation, Geneva.
Yamane T 1967. Statistics: An introductory analysis. American journal of applied mathematics and statistics. 4 (6): 178-184.
Yusoff MSB 2019. ABC of content validation and content validity index calculation. Education in medicine journal. 11: 49-54.
Type of article: orginal article |
Subject:
public specific
Send email to the article author
| Rights and permissions | |
 |
This work is licensed under a Creative Commons Attribution-NonCommercial 4.0 International License. |
