
Thu, Apr 25, 2024
[Archive]
Volume 5, Issue 4 (Nov 2020)
JNFS 2020, 5(4): 365-376 |
Back to browse issues page


Download citation:
BibTeX | RIS | EndNote | Medlars | ProCite | Reference Manager | RefWorks
Send citation to:


BibTeX | RIS | EndNote | Medlars | ProCite | Reference Manager | RefWorks
Send citation to:
Azimi T, Eghtesadi S, Abbasi B. The Comparison of Major Dietary Patterns in People with and without Calcium Oxalate Kidney Stone: A Case-Control Study. JNFS 2020; 5 (4) :365-376
URL: http://jnfs.ssu.ac.ir/article-1-312-en.html
URL: http://jnfs.ssu.ac.ir/article-1-312-en.html


Department of Nutrition, Science and Research Branch, Islamic Azad University, Tehran, Iran
Full-Text [PDF 862 kb]
(642 Downloads)
| Abstract (HTML) (1904 Views)
1 Department of Nutrition, Science and Research Branch, Islamic Azad University, Tehran, Iran.
Introduction
Full-Text: (2907 Views)
The Comparison of Major Dietary Patterns in People with and without Calcium Oxalate Kidney Stone: A Case-Control Study
Tahereh Azimi; MSc 1, Shahryar Eghtesadi; PhD *1 & Behnood Abbasi; PhD1
Tahereh Azimi; MSc 1, Shahryar Eghtesadi; PhD *1 & Behnood Abbasi; PhD1
1 Department of Nutrition, Science and Research Branch, Islamic Azad University, Tehran, Iran.
| ARTICLE INFO | ABSTRACT | |
| ORIGINAL ARTICLE | Background: It was suggested that dietary patterns might play a role in the pathogenesis of nephrolithiasis. The aim of this study was to determine the relationship between dietary patterns and the occurrence of calcium oxalate kidney stone disease. Methods: A case-control study was conducted on 634 male and female participants aged 18-65 in Tehran using a convenient sampling method. The participants were investigated in the case (n = 317) and control (n = 317) groups. Demographic and anthropometric information, medical history, physical activity, and dietary intake were collected by interview. A validated 147-item food frequency questionnaire was administered to assess the dietary patterns. Factor analysis was also applied with principal component approach (PCA) to determine the major dietary patterns. Results: The findings showed two major dietary patterns using 41 food groups. Significant differences were observed in nutritional factors and physical activity between the case and the control groups. After adjusting the covariates, the risk of calcium oxalate kidney stone was significantly higher for those in the highest tertile of unhealthy dietary pattern compared to the lowest ones (OR, 3.83; 95%CI, 2.22-6.61). Additionally, no relationship was found between the healthy dietary pattern and the risk of calcium oxalate kidney stone in any of the four logistic regression models (P for trend > 0.05) (OR,0.95; 95%CI, 0.58-1.55). Conclusion: We found that the unhealthy dietary pattern was strongly associated with increased risk for calcium oxalate kidney stones. Keywords: Dietary pattern; Nephrolithiasis; Calcium oxalate; Statistical factor analysis |
|
| Article history: Received:22 Apr 2020 Revised: 15 Aug 2020 Accepted: 15 Jul 2020 |
||
| *Corresponding author: segtesadi@gmail.com Science and Research Branch, Daneshgah Blvd, Simon Bulivar Blvd, Tehran, Iran. Postal code: 1477893855 Tel: +98-21 44865179 |
Introduction
Renal stone disease causes pain and cost (Weinberg et al., 2014) as well as some comorbidities such as hyperparathyroidism, hyperthyroidism, inflammatory bowel disease, renal tubular acidosis, immobility, and abdominal obesity in adults (Curhan et al., 1993). According to the National Health and Nutrition Examination Survey (NHANES) reports, the prevalence of kidney stone is 8.8% in adults and it affects 1 out of 11 persons in the united states (Scales Jr et al., 2012). The prevalence rates in Italy, Spain, and Scotland were 1.7%, 10%, and 3.5% in the 2010s, respectively (Romero et al., 2010). In Iran, the highest prevalence of kidney stone is reported in the age group of 50 to 59 years and the incidence rate is 154 per 100000 persons (Alatab et al., 2016). In western countries, the incidence of kidney stone in juveniles and adults has increased 37% during the past decades (Dwyer et al., 2012, Routh et al., 2010). The global prevalence of kidney stone was reported as 20% in the 2018s, which was higher in men (10.6%) than women (7.1%). Composition of approximately 80% of the kidney stones is formed by sedimentation of calcium oxalate (CaOx) crystals (Sakhaee et al., 2012). The physiopathology of kidney stone is not completely clear, although some factors such as age, gender, race, genetic factors, weather, fluid intake, urine pH, diet, overweight or obesity, immobility and lifestyle, metabolic disorders (that increases calcium levels in the urine), previous history of urinary stones, UTI (Urinary tract infection), hyperthyroidism, and neurogenic bladder may increase the possibility of kidney stone formation. In some studies, chance of formation of kidney stones was related to high consumption of zinc and vitamin C (Tang et al., 2012). It was proposed that dietary factors might have a role in the development and pathogenesis of this disorder (Leone et al., 2017). A number of studies examined the impact of separate food groups on kidney stones. These studies showed that high consumption of meats, sugar-sweetened beverages might increase the risk of kidney stones and high intake of fruits and vegetables was associated with a lower risk of kidney stones (Borghi et al., 2002, Ferraro et al., 2013, Turney et al., 2014). Dietary patterns can define the composition and variation of the food groups, micronutrients, and the usual frequency of food intake (Cespedes and Hu, 2015). To the best of our knowledge, only a few studies assessed the relationship between major dietary patterns in patients with kidney stone in Middle Eastern countries (Maddahi et al., 2017). Based on the synergistic effect of the dietary patterns on disorders risk, it was suggested to focus on the dietary patterns instead of nutrients or food groups (Calton et al., 2014).
In this case-control study, we extracted the major dietary patterns as risk factors for CaOx kidney stones in men and women from Tehran City, Iran. As a secondary aim, we compared the major dietary patterns in patients with and without calcium oxalate kidney stone.
Materials and Methods
Study population: This case control study was conducted among men and women within the age range of 18-65 years using the convenient sampling from October 2017 to August 2018. The current study included 317 kidney stone patients who referred to the Hasheminejad and Moheb Hospitals in Tehran and 317 healthy controls. Cases who reported a history of irritable bowel syndrome, hyperparathyroidism, hyperthyroidism, inflammatory bowel disease, ileostomy, and
celiac disease were not enrolled in the study (Curhan et al., 1993). The control group members were selected among the healthy people using convenient sampling method. We excluded the participants who did not answer at least 20 percent of the food items in food frequency questionnaire (FFQ) and reported under 800 kcal or over 4200 kcal of daily energy intake (Maddahi et al., 2017).
Dietary intake assessment: A valid and reliable food frequency questionnaire with 147 items of foods (FFQ) (Mirmiran et al., 2010) was used to assess the usual food intake over the past year. In order to estimate the amount of macronutrients and micronutrients intake, we applied nutritionist_4 software modified for Iranian foods.
Physical activity assessment: Physical activity levels were measured by Short Form of International Physical Activity Questionnaire (SF-IPAQ). We evaluated the frequency (days per week) and duration (minutes per day) of three types of activities including walking (3.3 METs), moderate-intensity (4.0 METs), and vigorous-intensity(8.0 METs) (Lee et al., 2011). Later, we calculated Met-minutes/week score of each activity using the following formula: MET* minutes * days. Later, the scores were added together to calculate the final physical activity level.
Anthropometric measurement: A trained questioner measured the participants’ height using a non-stretchable measuring tape with a precision of 0.1 cm, while standing by the wall without shoes. Furthermore, the Omron flat digital scale was applied to measure the participants’ weight to the nearest 0.1 kg, while the participants were wearing minimal clothing without shoes. Later, we calculated the body mass index (BMI) as weight in kilograms divided by the square of height in meter.
Demographic characteristics, disease history such as diabetes mellitus (DM) and hypertension (HTN), consumption of vitamin B6 supplement, and history of smoking were assessed by the general self-reported questionnaires.
Data analyses: Factor analysis with principal component approach (PCA) was administered to determine the major dietary patterns. To this end, 147 food items were classified into 41 food groups based on the similarities of foods and based on previous studies (Table 1). We applied Kaiser-Meyer-Olkin (KOM) and Bartlett's tests for assessing the adequacy of sample size and performance of factor analysis method. To determine the number of factors (dietary patterns), we used Scree plot and Eigen values > 1. Varimax rotation was also conducted on matrix. The extracted dietary patterns were named based on the load of food groups in each component with factor-loading > 0.1. Each individual's factor scores for each food patterns were calculated by this formula:
Results
Demographic and anthropometric characteristics were assessed in two groups (Table 2). Significant differences in age, BMI, and energy intake were observed between cases and controls (P < 0.05). The mean of weight in the case group was significantly higher than that of the control group (P < 0.001). A significant association was found in the history of diabetes and hypertension between cases and controls (P < 0.001). In addition, the mean value of physical activity was lower in cases than the controls (P < 0.001) (Table 2).
The factor-loading matrices are shown in Table 3. The high positive loadings indicate strong association between the prescribed food groups and patterns; whereas, the negative loadings indicate inverse association with the patterns. We labeled these factors as the following: the healthy dietary pattern (high in whole grains, legumes, poultry, fishes, eggs, low fat dairy, other dairy products, natural juices, dried fruits, olive, olive oil, liquid vegetable oils, nuts, fruits, vegetables, citrus, and coffee) and the unhealthy dietary pattern (high in refined grain, fast foods, salty snacks, sweets and desserts, red meat, processed fish, organ meats, processed meats, high fat dairy, solid vegetable oils, saturated fat, tomato sauce, salty pickles, canned fruits, industrial juices, mayonnaise, simple sugar, soft drinks, tea, salt). The association of healthy and unhealthy dietary patterns with the risk for calcium oxalate kidney stone is displayed in Table 4. We assessed each of the three tertiles of consuming each element and adjusted for the multivariable. The linear trend across tertiles of the unhealthy dietary pattern was statistically significant in all models (P for trend < 0.001) (OR, 3.83; 95%CI, 2.22-6.61). However, no significant association was found between the healthy dietary pattern and the risk of CaOx kidney stone in the four logistic regression models (P for trend > 0.05) (OR,0.95; 95%CI, 0.58-1.55) (Table 4).
According to the analysis, individuals in the upper tertile of the healthy dietary pattern scores were more physically active compared to those in the lowest tertile (P for trend < 0.001). Lower intakes of caffeine and higher intakes of carbohydrate were observed among those in the top tertile of healthy dietary pattern. In contrast, those in the highest tertile of unhealthy dietary pattern consumed more caffeine and less protein. We found that the number of smokers in the upper tertile of the unhealthy dietary pattern was higher compared with the lowest ones (P < 0.001). In addition, the mean age and weight of participants in the top tertile of unhealthy dietary pattern increased compared with the lowest tertile (P for trend < 0.001) (Table 5).
In this case-control study, we extracted the major dietary patterns as risk factors for CaOx kidney stones in men and women from Tehran City, Iran. As a secondary aim, we compared the major dietary patterns in patients with and without calcium oxalate kidney stone.
Materials and Methods
Study population: This case control study was conducted among men and women within the age range of 18-65 years using the convenient sampling from October 2017 to August 2018. The current study included 317 kidney stone patients who referred to the Hasheminejad and Moheb Hospitals in Tehran and 317 healthy controls. Cases who reported a history of irritable bowel syndrome, hyperparathyroidism, hyperthyroidism, inflammatory bowel disease, ileostomy, and
celiac disease were not enrolled in the study (Curhan et al., 1993). The control group members were selected among the healthy people using convenient sampling method. We excluded the participants who did not answer at least 20 percent of the food items in food frequency questionnaire (FFQ) and reported under 800 kcal or over 4200 kcal of daily energy intake (Maddahi et al., 2017).
Dietary intake assessment: A valid and reliable food frequency questionnaire with 147 items of foods (FFQ) (Mirmiran et al., 2010) was used to assess the usual food intake over the past year. In order to estimate the amount of macronutrients and micronutrients intake, we applied nutritionist_4 software modified for Iranian foods.
Physical activity assessment: Physical activity levels were measured by Short Form of International Physical Activity Questionnaire (SF-IPAQ). We evaluated the frequency (days per week) and duration (minutes per day) of three types of activities including walking (3.3 METs), moderate-intensity (4.0 METs), and vigorous-intensity(8.0 METs) (Lee et al., 2011). Later, we calculated Met-minutes/week score of each activity using the following formula: MET* minutes * days. Later, the scores were added together to calculate the final physical activity level.
Anthropometric measurement: A trained questioner measured the participants’ height using a non-stretchable measuring tape with a precision of 0.1 cm, while standing by the wall without shoes. Furthermore, the Omron flat digital scale was applied to measure the participants’ weight to the nearest 0.1 kg, while the participants were wearing minimal clothing without shoes. Later, we calculated the body mass index (BMI) as weight in kilograms divided by the square of height in meter.
Demographic characteristics, disease history such as diabetes mellitus (DM) and hypertension (HTN), consumption of vitamin B6 supplement, and history of smoking were assessed by the general self-reported questionnaires.
Data analyses: Factor analysis with principal component approach (PCA) was administered to determine the major dietary patterns. To this end, 147 food items were classified into 41 food groups based on the similarities of foods and based on previous studies (Table 1). We applied Kaiser-Meyer-Olkin (KOM) and Bartlett's tests for assessing the adequacy of sample size and performance of factor analysis method. To determine the number of factors (dietary patterns), we used Scree plot and Eigen values > 1. Varimax rotation was also conducted on matrix. The extracted dietary patterns were named based on the load of food groups in each component with factor-loading > 0.1. Each individual's factor scores for each food patterns were calculated by this formula:
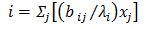
In this equation, bij represents the factor loading of food group, λi is Eigen-value of dietary pattern, and xj is the amount of food intake.
We used Kolmogorov–Smirnov for testing the normality of quantitative variables. Independent t-test was applied for comparing the quantitative variables in the case of normal distribution, such as anthropometric indices and dietary intakes between cases and controls. In the case of non-normal distribution, Mann–Whitney was used as a non-parametric test and chi-square test was used for categorical variables. To compare the mean quantitative variables, in the case of normal distribution among the tertiles of dietary patterns, we used one-way ANOVA. In the case of non-normal distribution, Kruskal–Wallis was used as a non-parametric test. For categorical variables, chi-square test was run. The general linear model (ANCOVA) was performed to calculate age and energy adjusted means of dietary intakes among the tertiles of dietary patterns. At the end, we used multivariable logistic regression to examine the relationship between the identified dietary patterns and CaOx kidney stone. The odds ratio (OR) and 95% confidence interval were calculated in the crude and adjusted models. Model I (crude) was an unadjusted model. In model II adjustments were made for age, gender, and BMI. In model III, education, smoking, diabetes, and hypertension were added to the previous adjustments. In model IV, physical activity, total energy intake, and vitamin B6 supplementation were added to the previous adjustments. To calculate the trend of OR (p-trend) across the increasing tertiles of dietary patterns, we considered medians of dietary patterns as independent variable (covariate) in the logistic regression models. The SPSS (version 24) was run in order to perform the statistical analysis of the data. In this study, p-value of less than 0.05 was considered as the significant level.
Ethical considerations: A consent letter was obtained from all patients and the Ethics Committee approved the study protocol (IeD: IR.IAU.SRB.REC.1396.45).Results
Demographic and anthropometric characteristics were assessed in two groups (Table 2). Significant differences in age, BMI, and energy intake were observed between cases and controls (P < 0.05). The mean of weight in the case group was significantly higher than that of the control group (P < 0.001). A significant association was found in the history of diabetes and hypertension between cases and controls (P < 0.001). In addition, the mean value of physical activity was lower in cases than the controls (P < 0.001) (Table 2).
The factor-loading matrices are shown in Table 3. The high positive loadings indicate strong association between the prescribed food groups and patterns; whereas, the negative loadings indicate inverse association with the patterns. We labeled these factors as the following: the healthy dietary pattern (high in whole grains, legumes, poultry, fishes, eggs, low fat dairy, other dairy products, natural juices, dried fruits, olive, olive oil, liquid vegetable oils, nuts, fruits, vegetables, citrus, and coffee) and the unhealthy dietary pattern (high in refined grain, fast foods, salty snacks, sweets and desserts, red meat, processed fish, organ meats, processed meats, high fat dairy, solid vegetable oils, saturated fat, tomato sauce, salty pickles, canned fruits, industrial juices, mayonnaise, simple sugar, soft drinks, tea, salt). The association of healthy and unhealthy dietary patterns with the risk for calcium oxalate kidney stone is displayed in Table 4. We assessed each of the three tertiles of consuming each element and adjusted for the multivariable. The linear trend across tertiles of the unhealthy dietary pattern was statistically significant in all models (P for trend < 0.001) (OR, 3.83; 95%CI, 2.22-6.61). However, no significant association was found between the healthy dietary pattern and the risk of CaOx kidney stone in the four logistic regression models (P for trend > 0.05) (OR,0.95; 95%CI, 0.58-1.55) (Table 4).
According to the analysis, individuals in the upper tertile of the healthy dietary pattern scores were more physically active compared to those in the lowest tertile (P for trend < 0.001). Lower intakes of caffeine and higher intakes of carbohydrate were observed among those in the top tertile of healthy dietary pattern. In contrast, those in the highest tertile of unhealthy dietary pattern consumed more caffeine and less protein. We found that the number of smokers in the upper tertile of the unhealthy dietary pattern was higher compared with the lowest ones (P < 0.001). In addition, the mean age and weight of participants in the top tertile of unhealthy dietary pattern increased compared with the lowest tertile (P for trend < 0.001) (Table 5).
| Table 1. Food grouping used in dietary pattern analysis | |
| Food groups | Food items |
| Refined grains | White breads, white rice, spaghetti, vermicelli, noodles, baguette bread |
| Whole grains | Iranian dark breads, barely, corn, whole biscuit |
| Boiled potato | Potato |
| Fast foods | Hamburger, pizza, French fries |
| Salty snacks | Cracker, potato chips, salty snacks |
| Sweets and desserts | Cakes, chocolates, gaz (Iranian sweet), cookie, halvah |
| Legumes | Lentils, kidney beans, chickpeas, soy beans, mung bean, split peas |
| Red meats | Beef, veal, sheep, mince meat |
| Poultry | Poultry without skin, chick |
| Fish | Trout and Other fishes |
| Processed fish | fish tuna canned |
| Organ meats | Lamb liver, lamb kidneys, lamb heart, lamb tongue, lamb brain |
| Processed meats | Beef sausages |
| Eggs | Eggs |
| Low fat dairy | low fat milk, low fat yogurt |
| High fat dairy | High fat milk, cocoa milk, high fat yogurt, creamy yogurt, cream cheese, other cheese, chocolate ice cream, vanilla ice cream |
| Other dairy products | Yogurt drink Dough, kashk |
| Saturated fat | Butter, animal fats, margarine, cream |
| Tomato sauce | Tomato sauce |
| Salty and Pickles | Cucumber pickles, mixed vegetables pickles |
| Natural juices | Orange juice, apple juice, melon juice |
| Dried fruits | Dried fig, raisin, dried berry, dehydrated peach, dehydrated apricot |
| Olive | Green olive |
| Olive oil | Olive oil |
| Canned fruits | Canned pineapple, canned mixed fruit |
| Industrial juices | Fruit juice packed, industrial lemon juice |
| Liquid vegetable oils | Liquid vegetable oils |
| Solid vegetable oils | Hydrogenated fats |
| Mayonnaise | Mayonnaise |
| Nuts | Peanuts, almonds, walnuts, pistachios, hazelnuts, sunflower seeds |
| High oxalate fruits | Green tomato, fig, kiwifruit, persimmon, pomegranate, date, strawberry |
| Low oxalate fruits | Melon, honeydew melon, watermelon, pear, apricot, cherries, apple, peach, nectarine, grape, plum, banana, mulberry |
| High oxalate vegetables | Broad bean, tomato, parsley, eggplant, celery, green peas, green beans, carrot, garlic, spinach, turnip, green pepper |
| Low oxalate vegetables | Lettuce, cucumber, basil, pumpkin, squash, onion, cabbage, bell pepper, mushroom |
| Citrus | grapefruit, orange, tangerine, sweet lemon, lemon |
| Simple sugar | white granulated sugar, Sugar, honey, jam, candy |
| Soft drinks | Soft drinks |
| Tea | Tea |
| Coffee | Coffee |
| Salt | Salt |
| Condiments | Green pepper powder, turmeric |
| Table 2. Characteristics, energy and dietary intakes of participants with and without calcume oxalate kidney stone | |||
| P-value | Control ( n = 317 ) | Case ( n = 317 ) | Variables |
| > 0.001c | 38.00 ± 11.48 | 41.03 ± 11.03a | Age (year) |
| > 0.001c | 74.47 ± 14.23 | 80.89 ± 14.05 | Weight (kg) |
| > 0.001c | 26.33±3.90 | 27.42 ± 4.08 | Body mass index (kg/m2) |
| > 0.001e | 2480.23 ± 256.40 | 2113.68 ±2667.14 | Physical activity(MET h/wk) |
| 0.003 f | 2532.3 ± 40.4 | 2705.5 ± 40.5 | Energy intake (kcal) |
| > 0.070 f | 58.3 ± 0.3 | 59.1 ± 0.3 | Carbohydrate, % of total energy |
| > 0.001 f | 14.7 ± 0.1 | 13.9±0.1 | Protein, % of total energy |
| 0.480f | 29.3 ± 1.7 | 29.6 ± 1.7 | Fat, % of total energy |
| > 0.001 f | 60.23 ± 3.4 | 77.24 ± 3.4 | Caffeine, mg/1000 kcal f |
| > 0.001d |
165 (38.2) 152 (75.2) |
267 (61.8)b 50 (24.8) |
Gender Male Female |
| > 0.001d |
161 (25.4) 85 (13.4) 71 (11.2) |
238 (37.5) 49 (7.7) 30 (4.7) |
Education Undergraduate Graduate Postgraduate |
| 0.007d |
6 (0.9) 131 (20.7) 134 (21.1) 46 (7.3) |
4 (0.6) 102 (16.1) 133 (21.0) 78 (12.3) |
Nutritional status Underweight Normal Overweight Obese |
| > 0.001d | 53 (68.8) | 24 (31.2) | Vitamin B6 supplement use |
| < 0.001d | 25 (3.9) | 80 (12.6) | Smoking |
| >0.001d | 37 (5.8) | 86 (13.6) | History of diabetes and hypertension |
| a: Mean ± SD; b: n (%); c: Independent t-test; d: Chi-square; e: Mann-Whitney test; f: Obtained from the general linear model and adjusted for energy intake and age (means ± SEM) | |||
| Table 3. Factor loading matrix for the two major dietary patterns | ||
| Food groups | Healthy dietary pattern | Unhealthy dietary pattern |
| Refined grains | -0.113 | 0.317 |
| Whole grains | 0.194 | - |
| Boiled potato | - | 0.181 |
| Fast foods | - | 0.219 |
| Salty snacks | - | 0.382 |
| Sweets and desserts | - | 0.318 |
| Legumes | 0.224 | - |
| Red meats | - | 0.335 |
| Poultry | 0.145 | - |
| Fish | 0.380 | - |
| Processed fish | - | 0.230 |
| Organ meats | - | 0.444 |
| Processed meats | -0.108 | 0.378 |
| Eggs | 0.193 | - |
| Low fat dairy | 0.236 | -0.226 |
| High fat dairy | - | 0.430 |
| Other dairy products | 0.212 | - |
| Saturated fat | - | 0.260 |
| Tomato sauce | - | 0.436 |
| Salty and Pickles | - | 0.360 |
| Natural juices | 0.313 | - |
| Dried fruits | 0.330 | - |
| Olive | 0.343 | - |
| Olive oil | 0.396 | - |
| Canned fruits | - | 0.347 |
| Industrial juices | - | 0.375 |
| Liquid vegetable oils | 0.114 | - |
| Solid vegetable oils | -0.198 | 0.305 |
| Mayonnaise | - | 0.458 |
| Nuts | 0.323 | - |
| High oxalate fruits | 0.577 | - |
| Low oxalate fruits | 0.485 | - |
| High oxalate vegetables | 0.613 | - |
| Low oxalate vegetables | 0.696 | - |
| Citrus | 0.503 | - |
| Simple sugar | -0.105 | 0.368 |
| Soft drinks | -0.117 | 0.514 |
| Tea | - | 0.256 |
| Coffee | 0.155 | - |
| Salt | -0.150 | 0.313 |
| Condiments | - | - |
| Percentage of variance | 8.55 | 6.13 |
| Cumulative percentage of variance explained by two dietary patterns was 14.68% factor loadings < 0.10 were excluded. | ||
| Table 4. Multivariate adjusted odds ratio (OR) and 95% confidence interval (CI) for calcium oxalatex kidney stone among tertiles of dietary patterns scores | ||||||||
| Unhealthy dietary pattern | Healthy dietary pattern | |||||||
| P-trend | Tertile3 (n = 211) | Tertile2 (n =211) | Tertile1 (n = 212) | P-trend | Tertile3 (n = 212) | Tertile2(n = 210) | Tertile1 (n=212) | |
| < 0.001 | 4.09 ( 2.72- 6.13) | 1.71 ( 1.16- 2.53) | 1 | 0.59 | 0.89 (0.61- 1.30) | 0.79 (0.54 -1.16) | 1 | Model 1 |
| < 0.001 | 3.10 ( 2.02- 4.76) | 1.65 ( 1.08- 2.51) | 1 | 0.74 | 0 .92 ( 0.61- 1.39) | 0.81 (0.54- 1.22) | 1 | Model 2 |
| < 0.001 | 2.75 ( 1.77- 4.26) | 1.47 ( 0.96- 2.26) | 1 | 0.67 | 0.90 ( 0.58- 1.38) | 0.82 ( 0.53- 1.25) | 1 | Model 3 |
| < 0.001 | 3.83 ( 2.22- 6.61) | 1.69 ( 1.07- 2.67) | 1 | 0.88 | 0.95 ( 0.58- 1.55) | 0.83 ( 0.53- 1.29) | 1 | Model 4 |
| Resulted from logistic regression; Values are OR (95% CI); Model 1: crude; Model 2 adjusted for age, gender and body mass index, Model 3 adjusted for age, gender, body mass index education, smoking, diabetes and Model 4 adjusted for age, gender, body mass indem, hypertension history, physical activity, energy intake and vitamin B6 | ||||||||
| Table 5. Characteristics, energy and dietary intakes of participants among tertiles of dietary patterns scores | ||||||||
| Unhealthy dietary pattern | Healthy dietary pattern | Variables | ||||||
| P-trend | Tertile3 (n =211) |
Tertile2 (n =211) |
Tertile1 (n =212) |
P-trend | Tertile3 (n = 212) |
Tertile2 (n =210) |
Tertile1 (n=212) |
|
| 0.001c | 41.10 ± 11.54 | 37.20 ± 10.71 | 40.24 ± 11.45 | 0.12 | 40.80 ± 11.29a | 38.82 ± 11.34 | 38.92 ± 11.35 | Age (year) |
| 0.001c | 80.54 ± 14.19 | 77.43 ± 14.63 | 75.09 ± 14.18 | 0.42 | 78.61 ± 14.90 | 77.66 ± 14.44 | 76.77 ± 14.13 | Weight (kg) |
| 0.09 c | 27.34 ± 4.13 | 26.79 ± 4.03 | 26.50 ± 3.89 | 0.074 | 27.32 ± 3.90 | 26.87 ± 4.07 | 26.43 ± 4.08 | Body mass index (kg/m2) |
| < 0.001d |
177 (83.9) 34 (16.1) |
136 (64.5) 75 (35.5) |
119 (56.1) 93 (43.9) |
0.37 |
139 (65.6) 73 (34.4) |
141 (67.1) 69 (32.9) |
152 (71.7)b 60 (28.3) |
Gender Male Female |
| < 0.001d |
162 (8.7) 29 (7.1) 20 (5.9) |
127 (2.6) 49 (2.2) 35 (6.1) |
110 (9.5) 56 (4.2) 46 (7.2) |
0.97 |
137 (6.6) 44 (8.2) 31 (6.1) |
130 (9.6) 45 (4.2) 35 (7.1) |
132 (3.6) 45 (2.2) 35 (5.1) |
Education Undergraduate Graduate Postgraduate |
| 0.08d | 48 (7.2) | 44 (9.2) | 31 (6.1) | 0.06 | 52 (5.2) | 37 (6.1) | 34 (16.0) | History of Diabetes and hypertension |
| 0.11d |
5 (2.4) 63 (29.9) 93 (44.1) 50 (23.7) |
2 (0.9) 84 (39.8) 83 (39.3) 42 (19.9) |
3 (1.4) 86 (40.6) 91 (42.9) 32 (15.1) |
0.55 |
2 (0.9) 72 (34.0) 92 (43.4) 46 (21.7) |
2 (1.0) 80 (38.1) 87 (41.4) 41 (19.5) |
6 (2.8) 81 (38.2) 88 (41.5) 37 (17.5) |
Nutritional status Underweight Normal Overweight Obese |
| 0.38d | 22 (10.4) | 24 (11.4) | 31 (14.6) | 0.48 | 29 (13.7) | 21 (10.0) | 27 (12.7) | Vitamin B6 supplement use |
| < 0.001d | 60 (28.4) | 32 (15.2) | 13 (6.1) | 0.35 | 30 (14.2) | 34 (16.2) | 41 (19.3) | Smoking |
| 0.85e | 2418 ± 2918 | 2314 ± 2683 | 2158 ± 2213 | < 0.001 |
2845 ± 2824 | 2284 ± 2451 | 1760 ± 2461 | Physical activity (MET-h/wk) |
| < 0.00f | 3127 ± 40 | 2622 ± 40 | 2110 ± 40 | < 0.001 | 2249 ± 44 | 2601 ± 44 | 3007 ± 44 | Energy intake (kcal) |
| 0.67f | 58.98±0.39 | 58.48±0.39 | 58.68±0.39 | 0.005 | 59.68±0.39 | 58.59±0.39 | 57.88±0.39 | Carbohydrate, % of total energy |
| < 0.00f | 13.59±0.14 | 14.47±0.14 | 15.05±0.14 | 0.38 | 14.52±0.14 | 14.35±0.14 | 14.23±0.14 | Protein, % of total energy |
| 0.62f | 29.72±0.37 | 29.66±0.37 | 29.25±0.37 | 0.18 | 28.99±0.37 | 29.74±0.37 | 29.89±0.37 | Fat, % of total energy |
| < 0.00f | 108.49±3.76 | 60.40±3.77 | 37.44±3.74 | 0.02 | 61.75±4.24 | 66.83±4.25 | 77.59±4.23 | Caffeine, mg/1000 kcal |
| a: Mean ± SD; b: n (%); c: ANOVA test; d: Chi-square; e: Kruskal–Wallis t; f: Obtained from the general linear model and adjusted for energy intake and age (means ± SEM) | ||||||||
Discussion
We used factor analysis using 41 food groups and identified two major healthy and unhealthy dietary patterns. In most previously published studies on dietary patterns, two or three dietary patterns were extracted (Joung et al., 2012), which is in line with our findings. The identified patterns in our study were similar to the others carried out across the world over the years (Hu et al., 1999). Based on the findings, many food groups and nutrients are associated with the risk of CaOx kidney stones, although evidences supporting the relationship between dietary patterns and CaOx kidney stone were limited. Although the study by Leone et al. evaluated the association between the Mediterranean dietary pattern and risk for nephrolithiasis (Leone et al., 2017), the current case-control study might be the first research exploring the association between the major dietary patterns and risk of CaOx kidney stone to our best knowledge.
According to our findings, unhealthy dietary pattern increases the risk of CaOx kidney stone, although no association has been found between the healthy dietary pattern and the risk of CaOx kidney stone (Maddahi et al., 2017).
We observed that the highest tertiles of unhealthy dietary pattern were more likely to consume high calorie foods compared to the lowest ones. Previous studies confirmed our findings about the high energy intake as a risk factor of the incidence of kidney stone (Esperto et al., 2018). Red meat is totally considered as a high calorie food that may play a key role in terms of the observed association between high calorie intake and the risk of kidney stones. Turney et al. depicted that increase of meat consumption was associated with higher risk of hospitalization due to kidney stones (Turney et al., 2014). Accordingly, Neil et al. reported that animal proteins intake may lead to increase of urinary oxalate and calcium extraction as well as reduced urinary pH, which leads to the increased risk of kidney stone (Breslau et al., 1988).
We also observed that high saturated fat consumption in unhealthy dietary pattern may be responsible for the observed association between unhealthy dietary pattern and risk of kidney stones. Association between fat and risk of kidney stones is still a controversial issue. Several studies reported that higher consumption of high fat dairy was directly associated with higher risk of CaOx kidney stone (Curhan et al., 1993, Dai et al., 2013). In contrary, other studies found no association between diary fat intake and kidney stones. Turney et al. found no association between fat intake and risk of kidney stones that supported our findings as we observed no significant difference in fat intake between the highest and lowest tertiles of the unhealthy dietary pattern (Turney et al., 2014).
We observed no statistically significant difference between the highest and lowest tertiles of the unhealthy dietary patterns regarding carbohydrates intake. In other words, no association exists between carbohydrates consumption and risk of kidney stones. Moreover, the participants consumed 108.4 mg per 1000 kcal caffeine in this study. Our finding is supported by previous similar studies in this area. Taylor et al. found that carbohydrate was not associated with kidney stone formation (Taylor and Curhan, 2008). In addition, caffeine intake can be regarded as a risk factor for kidney stones, as the highest tertile of unhealthy dietary patterns tends to consume more caffeine and the observed difference between compared groups was statistically significant. Massey et al. reported that a high caffeine diet increased the risk of kidney stone (Massey and Sutton, 2004). Caffeine caused urinary calcium elimination without increase in the glomerular filtration rate (McPhee and Whiting, 1989).
In agreement with our findings, consumption of fruits and vegetables without considering the oxalate content might also reduce the risk of kidney stone (Taylor and Curhan, 2006). Friedlander et al. found that fruits and vegetables might increase the urinary citrate extraction that leads to alkaline urine (Friedlander et al., 2015). Moreover, several studies reported protective effect for vegetables and fruits in terms of stone diseases risk (Hess et al., 1994, Meschi et al., 2004).
We also found an inverse association between intake of vitamin B6 supplementation and risk of kidney stones. However, the results of previous researches are controversial. Curhan et al. refuted that there was an association between intake of vitamin B6 supplementation and the risk of kidney stone in tertiles of healthy dietary pattern (Curhan et al., 1999); whereas, Rattan et al. found that 10 to 500 mg/d of vitamin B6 consumption might decrease the urinary oxalate (Rattan et al., 1994).
Low educational level might increase the risk of kidney stone (Ferraro et al., 2015). Participants in the highest tertile of the healthy dietary pattern had a significantly higher level of physical activity than those in the lowest tertile. More educated people have better access to health information; so, they have healthier life style including healthier diet and more physical activity (Hiza et al., 2013, Porterfield and McBride, 2007). In most studies, physical activity was inversely related to the incidence of kidney stone that might be due to the role of physical activity in preventing obesity, which is strongly associated with nephrolithiasis and consequently kidney stones (Ferraro et al., 2015, Molina-Molina et al., 2019, Taylor et al., 2005).
In contrast to our study, Weikert et al. and Kittanamongkolchai et al. found that diabetes
and hypertension might increase the risk of nephrolithiasis. Calcium oxalate crystals damaged tubular epithelial cells that increased inflammation markers and caused renal injury. Furthermore, insulin resistance might cause kidney stone formation (Kittanamongkolchai et al., 2017, Weikert et al., 2010).
We found higher salt intake among unhealthy dietary pattern group, which was associated to higher risk of kidney stones. High salt intake can lead to CaOx kidney stone formation by increasing calcium extraction(Nouvenne et al., 2009).
The results of the current study were
very similar to the studies by Hojhabrimanesh et al. and Holmes et al. with high intake of salt, french fries, and red meats, which incuded the unhealthy dietary factors associated with the increased risk of CaOx kidney stones. Overall, we can attribute our findings to intake of high calorie foods such as refined grains, sweets, and beverages (Hojhabrimanesh et al., 2017, Holmes and Assimos, 2004).
The most important limitation of current study was self-reported measurement of dietary intakes that may cause measurement error. Among the strength of the current study, its large sample size can be mentioned. Furthermore, we tried to select the study groups from all groups of the society such as athletes, employees, nurses, students, and patients.
Conclusion
In conclusion, we found that unhealthy dietary pattern was associated with the increased risk of calcium oxalate kidney stones, which is mostly due to the consumption of high calorie foods. However, future prospective studies are warranted and recommended.
Conflict of interest
The authors state no conflicts of interest.
Author’s contributions
All authors were involved in study design, data management and data analysis and writing the manuscript. They finally verified the final version of the manuscript.
Acknowledgments
This study was carried out using the data collected from Moheb and Hasheminejad Hospitals for an M.S thesis. We would like to thank all participants who helped us in data collection. We also express our deep gratitude to staffs of Moheb and Hasheminejad Hospitals who collaborated with us to conduct the study.
References
Alatab S, et al. 2016. National Profiles of Urinary Calculi A comparison Between Developing and Developed Worlds. Iranian Journal of Kidney Diseases. 10 (2): 51.
Borghi L, et al. 2002. Comparison of two diets for the prevention of recurrent stones in idiopathic hypercalciuria. New England Journal of Medicine. 346 (2): 77-84.
Breslau NA, Brinkley L, Hill KD & PAK CY 1988. Relationship of animal protein-rich diet to kidney stone formation and calcium metabolism. Journal of Clinical Endocrinology & Metabolism. 66 (1): 140-146.
Calton EK, James AP, Pannu PK & Soares MJ 2014. Certain dietary patterns are beneficial for the metabolic syndrome: reviewing the evidence. Nutrition Research. 34 (7): 559-568.
Cespedes EM & Hu FB 2015. Dietary patterns: from nutritional epidemiologic analysis to national guidelines. Oxford University Press.
Curhan GC, Willett WC, Rimm EB & Stampfer MJ 1993. A prospective study of dietary calcium and other nutrients and the risk of symptomatic kidney stones. New England Journal of Medicine. 328 (12): 833-838.
Curhan GC, Willett WC, Speizer FE & Stampfer MJ 1999. Intake of vitamins B6 and C and the risk of kidney stones in women. Journal of the American Society of Nephrology. 10 (4): 840-845.
Dai M, Zhao A, Liu A, You L & Wang P 2013. Dietary factors and risk of kidney stone: a case-control study in southern China. Journal of Renal Nutrition. 23 (2): e21-28.
Dwyer ME, et al. 2012. Temporal trends in incidence of kidney stones among children: a 25-year population based study. Journal of Urology. 188 (1): 247-252.
Esperto F, Miano R, Marangella M & Trinchieri A 2018. Impact of food quantity and quality on the biochemical risk of renal stone formation. Scandinavian Journal of Urology. 52 (3): 225-229.
Ferraro PM, Curhan GC, Sorensen MD, Gambaro G & Taylor EN 2015. Physical activity, energy intake and the risk of incident kidney stones. Journal of Urologys. 193 (3): 864-868.
Ferraro PM, Taylor EN, Gambaro G & Curhan GC 2013. Soda and other beverages and the risk of kidney stones. Clinical Journal of the American Society of Nephrology. 8 (8): 1389-1395.
Friedlander JI, Antonelli JA & Pearle MS 2015. Diet: from food to stone. World Journal of Urology. 33 (2): 179-185.
Hess B, Michel R, Takkinen R, Ackermann D & Jaeger P 1994. Risk factors for low urinary citrate in calcium nephrolithiasis: low vegetable fibre intake and low urine volume to be added to the list. Nephrology Dialysis Transplantation. 9 (6): 642-649.
Hiza HA, Casavale KO, Guenther PM & Davis CA 2013. Diet quality of Americans differs by age, sex, race/ethnicity, income, and education level. Journal of the Academy of Nutrition and Dietetics. 113 (2): 297-306.
Hojhabrimanesh A, et al. 2017. A Western dietary pattern is associated with higher blood pressure in Iranian adolescents. European Journal of Nutrition. 56 (1): 399-408.
Holmes RP & Assimos DG 2004. The impact of dietary oxalate on kidney stone formation. Urological Research. 32 (5): 311-316.
Hu FB, et al. 1999. Reproducibility and validity of dietary patterns assessed with a food-frequency questionnaire. American Journal of Clinical Nutrition. 69 (2): 243-249.
Joung H, Hong S, Song Y, Ahn BC & Park MJ 2012. Dietary patterns and metabolic syndrome risk factors among adolescents. Korean Journal of Pediatrics. 55 (4): 128-135.
Kittanamongkolchai W, et al. 2017. Risk of hypertension among first-time symptomatic kidney stone formers. Clinical Journal of the American Society of Nephrology. 12 (3): 476-482.
Lee PH, Macfarlane DJ, Lam T & Stewart SM 2011. Validity of the international physical activity questionnaire short form (IPAQ-SF): A systematic review. International Journal of Behavioral Nutrition and Physical Activity. 8 (1): 115.
Leone A, et al. 2017. Adherence to the Mediterranean dietary pattern and incidence of nephrolithiasis in the Seguimiento Universidad de Navarra follow-up (SUN) cohort. American Journal of Kidney Diseases. 70 (6): 778-786.
Maddahi NS, Mirzaei K, Aghamir SMK, Modaresi SS & Yekaninejad MS 2017. Major dietary patterns and kidney stone formation among Iranian men. Journal of Nutritional Sciences and Dietetics. 11-17.
Massey LK & Sutton RA 2004. Acute caffeine effects on urine composition and calcium kidney stone risk in calcium stone formers. Journal of Urology. 172 (2): 555-558.
McPhee MD & Whiting SJ 1989. The effect of adenosine and adenosine analogues on methylxanthine-induced hypercaliuria in the rat. Canadian Journal of Physiology and Pharmacology. 67 (10): 1278-1282.
Meschi T, et al. 2004. The effect of fruits and vegetables on urinary stone risk factors. Kidney International. 66 (6): 2402-2410.
Mirmiran P, Esfahani FH, Mehrabi Y, Hedayati M & Azizi F 2010. Reliability and relative validity of an FFQ for nutrients in the Tehran lipid and glucose study. Public Health Nutrition. 13 (5): 654-662.
Molina-Molina E, Shanmugam H, Wang D, Vergani L & Portincasa P 2019. Physical Activity is Beneficial for Gallbladder Disease. Japanese Journal of Gastroenterology and Hepatology. 1 (1): 1-4.
Nouvenne A, et al. 2009. Effects of a low-salt diet on idiopathic hypercalciuria in calcium-oxalate stone formers: a 3-mo randomized controlled trial. American Journal of Clinical Nutrition. 91 (3): 565-570.
Porterfield SL & McBride TD 2007. The effect of poverty and caregiver education on perceived need and access to health services among children with special health care needs. American Journal of Public Health. 97 (2): 323-329.
Rattan V, Sidhu H, Vaidyanathan S, Thind S & Nath R 1994. Effect of combined supplementation of magnesium oxide and pyridoxine in calcium-oxalate stone formers.Urological Research. 22 (3): 161-165.
Romero V, Akpinar H & Assimos DG 2010. Kidney stones: a global picture of prevalence, incidence, and associated risk factors. Reviews in Urology. 12 (2-3): e86.
Routh JC, Graham DA & Nelson CP 2010. Epidemiological trends in pediatric urolithiasis at United States freestanding pediatric hospitals. Journal of Urology. 184 (3): 1100-1105.
Sakhaee K, et al. 2012. Metabolic syndrome and the risk of calcium stones. Nephrology Dialysis Transplantation. 27 (8): 3201-3209.
Scales Jr CD, Smith AC, Hanley JM, Saigal CS & Project UDiA 2012. Prevalence of kidney stones in the United States. European Urology. 62 (1): 160-165.
Tang J, McFann K & Chonchol M 2012. Dietary zinc intake and kidney stone formation: evaluation of NHANES III. American Journal of Nephrology. 36 (6): 549-553.
Taylor E & Curhan G 2008. Fructose consumption and the risk of kidney stones. Kidney International. 73 (2): 207-212.
Taylor EN & Curhan GC 2006. Diet and fluid prescription in stone disease. Kidney International. 70 (5): 835-839.
Taylor EN, Stampfer MJ & Curhan GC 2005. Obesity, weight gain, and the risk of kidney stones. Journal of the American Medical Association. 293 (4): 455-462.
Turney BW, et al. 2014. Diet and risk of kidney stones in the Oxford cohort of the European Prospective Investigation into Cancer and Nutrition (EPIC). European Journal of Epidemiology. 29 (5): 363-369.
Weikert C, et al. 2010. Presence of gallstones or kidney stones and risk of type 2 diabetes. American Journal of Epidemiology. 171 (4): 447-454.
Weinberg AE, Patel CJ, Chertow GM & Leppert JT 2014. Diabetic severity and risk of kidney stone disease. European Urology. 65 (1): 242-247.
Type of article: orginal article |
Subject:
public specific
Received: 2020/04/22 | Published: 2020/11/15 | ePublished: 2020/11/15
Received: 2020/04/22 | Published: 2020/11/15 | ePublished: 2020/11/15
Send email to the article author
| Rights and permissions | |
 |
This work is licensed under a Creative Commons Attribution-NonCommercial 4.0 International License. |
